Fig. 4.
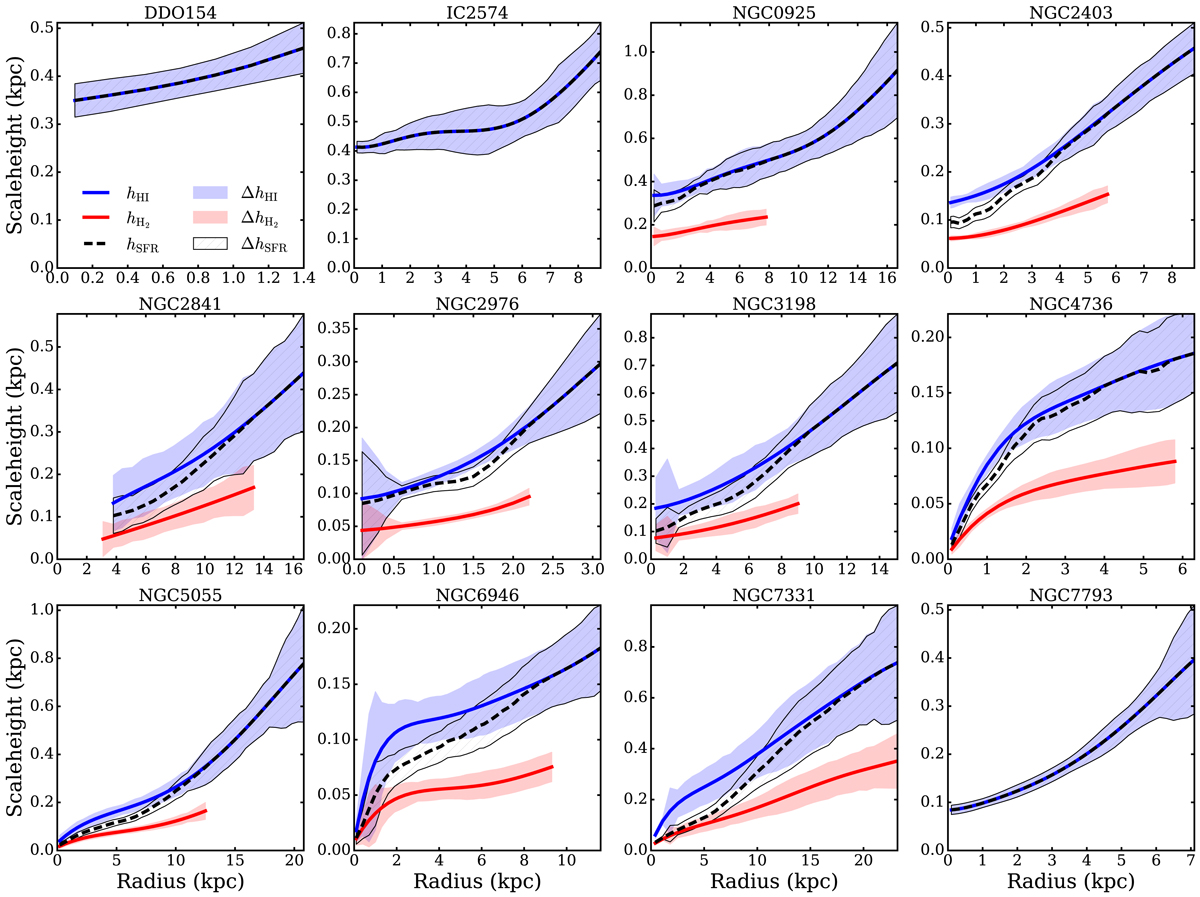
Scale height radial profiles: hHI(R) (solid blue) and hH2(R) (solid red) are calculated by GALPYNAMICS, while hSFR(R) (dashed black) is estimated using Eq. (17). We note that hH2(R) is shown out to the radius where CO emission is detected. The faded regions indicate the uncertainties on the gas scale heights, while the black dashed regions are the uncertainties on hSFR(R).
Current usage metrics show cumulative count of Article Views (full-text article views including HTML views, PDF and ePub downloads, according to the available data) and Abstracts Views on Vision4Press platform.
Data correspond to usage on the plateform after 2015. The current usage metrics is available 48-96 hours after online publication and is updated daily on week days.
Initial download of the metrics may take a while.