Fig. 2.
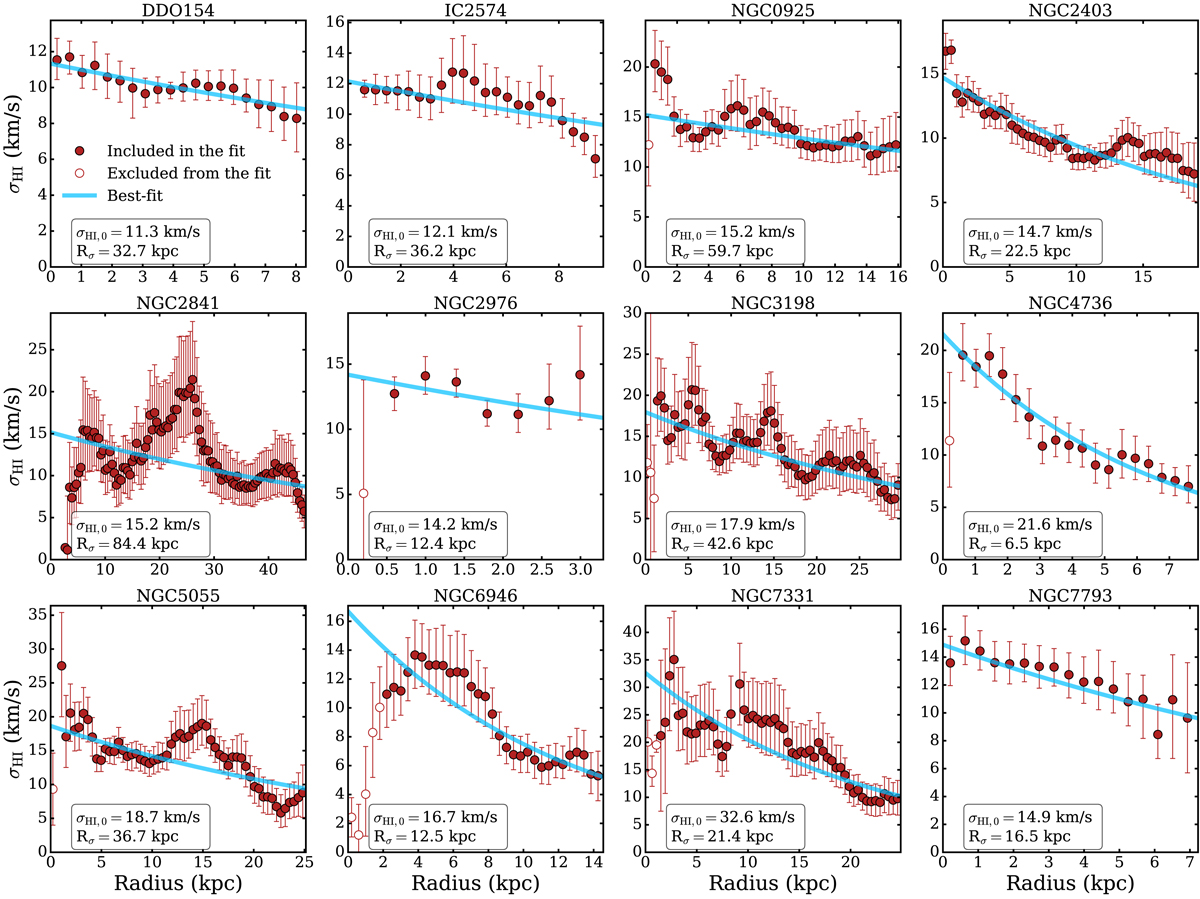
HI velocity dispersion measured using 3DBAROLO (filled and empty circles) for our galaxies with a common sampling of about 400 pc (for NGC 2841 we show one data point every two). The best-fit models (Eq. (11)) are shown by the light blue curves, whose parameters (σHI, 0 and Rσ) are reported in a box in the lower left corner of each panel. The points indicated by empty circles are excluded from the fit.
Current usage metrics show cumulative count of Article Views (full-text article views including HTML views, PDF and ePub downloads, according to the available data) and Abstracts Views on Vision4Press platform.
Data correspond to usage on the plateform after 2015. The current usage metrics is available 48-96 hours after online publication and is updated daily on week days.
Initial download of the metrics may take a while.