Free Access
Fig. 1.
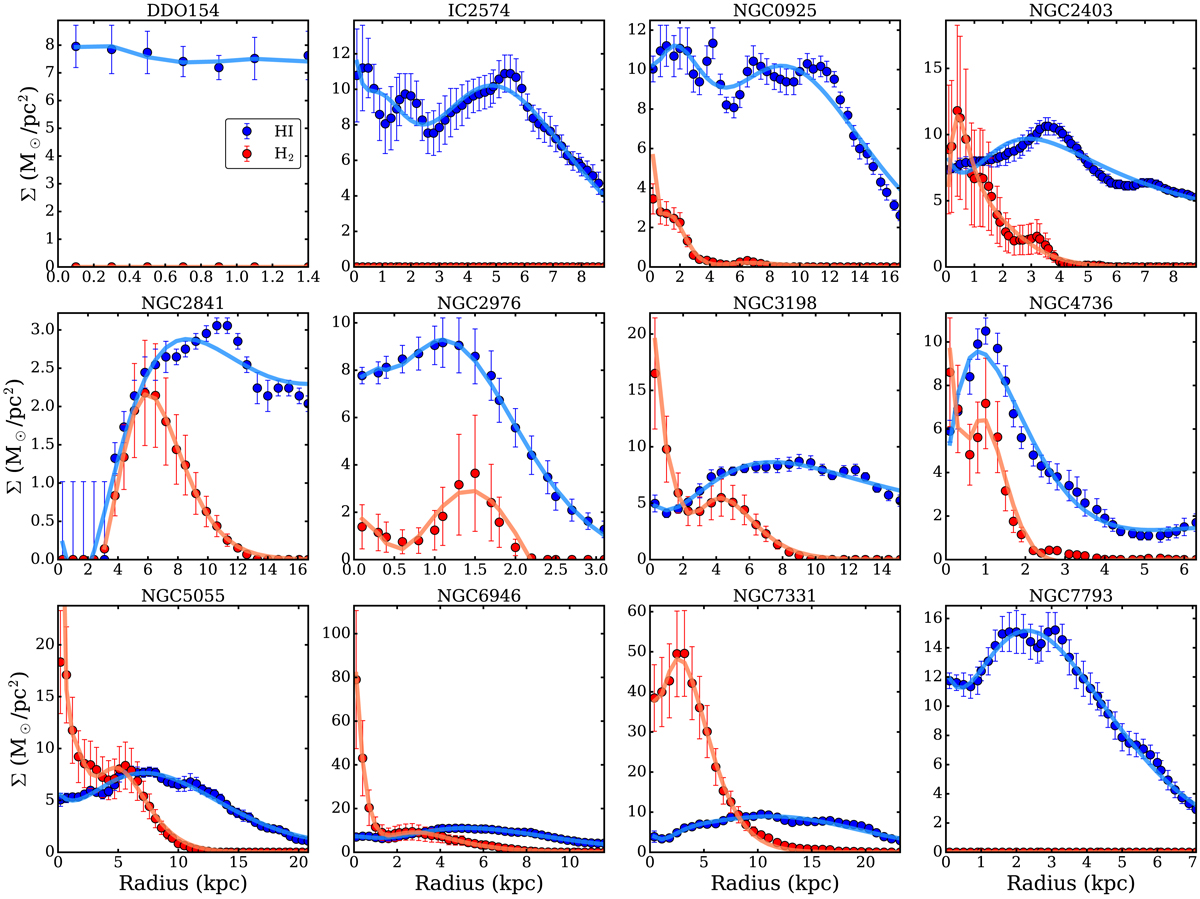
HI (Leroy et al. 2008, blue points) and H2 (Frank et al. 2016, red points) observed surface densities radial profiles. The light blue and coral curves show the models used to compute the scale heights and are obtained by fitting Eq. (10) to the observed profiles. Only the ranges where the SFR is measured are shown.
Current usage metrics show cumulative count of Article Views (full-text article views including HTML views, PDF and ePub downloads, according to the available data) and Abstracts Views on Vision4Press platform.
Data correspond to usage on the plateform after 2015. The current usage metrics is available 48-96 hours after online publication and is updated daily on week days.
Initial download of the metrics may take a while.