Fig. 3.
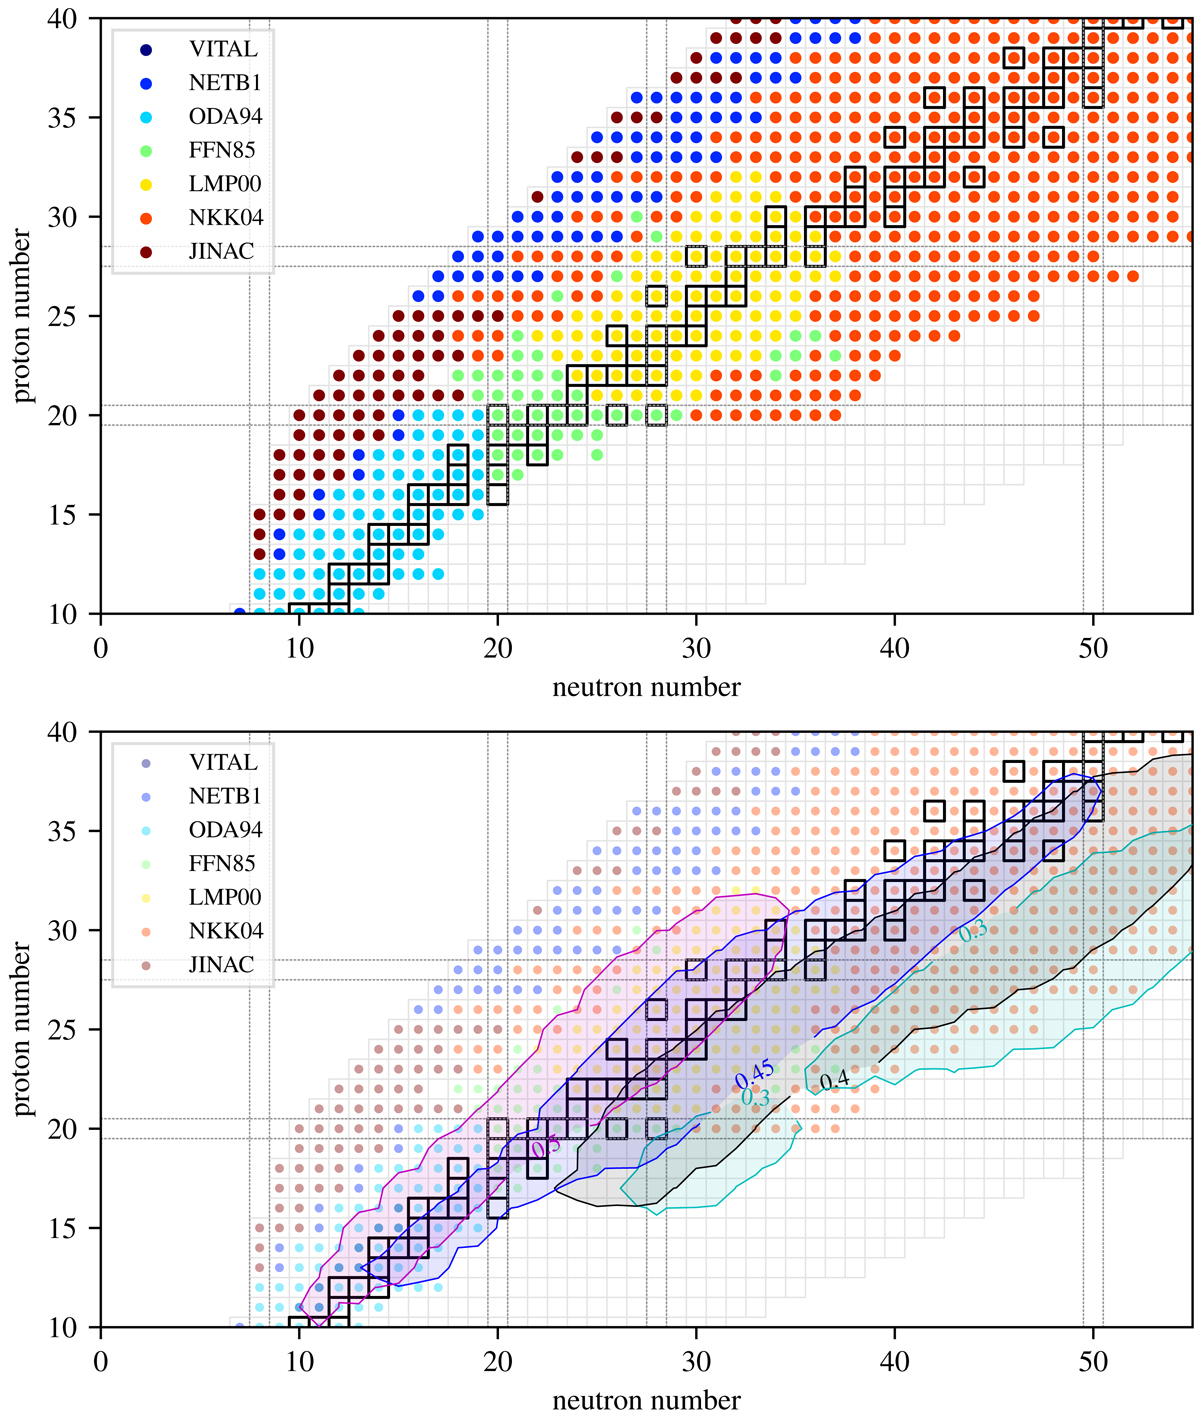
Top panel: sources of electron capture and positron decay ( β+) reaction rates in our reaction network. The labels are as follows: VITAL (only 7Be + e−→7Li + ν + γ from Caughlan & Fowler 1988); NETB1 (weak reaction rates from NetGen – http://www.astro.ulb.ac.be/Netgen – which are predominantly from Takahashi & Yokoi 1987 and Goriely 1999); ODA94 (Oda et al. 1994); FFN85 (Fuller et al. 1985); LMP00 (Langanke & Martínez-Pinedo 2000); NKK04 (Nabi & Klapdor-Kleingrothaus 2004); JINAC (Cyburt et al. 2010). Bottom panel: same as top panel; shaded regions cover isotopes with mass fraction greater than X = 5 × 10⁻⁶ for an NSE state at T = 9 GK and ρ = 1010 g cm−3. The value of Ye for each shaded region is written on the enclosing contour line. One can see that at Ye = 0.45 there are a substantial number of isotopes outside of the region covered by the Langanke & Martínez-Pinedo (2000) tables with mass fractions greater than X = 5 × 10⁻⁶, indicating that they could potentially contribute to the evolution of Ye when their weak reaction rates are considered, which is what we observe in our simulations when including the Nabi & Klapdor-Kleingrothaus (2004) rates.
Current usage metrics show cumulative count of Article Views (full-text article views including HTML views, PDF and ePub downloads, according to the available data) and Abstracts Views on Vision4Press platform.
Data correspond to usage on the plateform after 2015. The current usage metrics is available 48-96 hours after online publication and is updated daily on week days.
Initial download of the metrics may take a while.