Fig. 12.
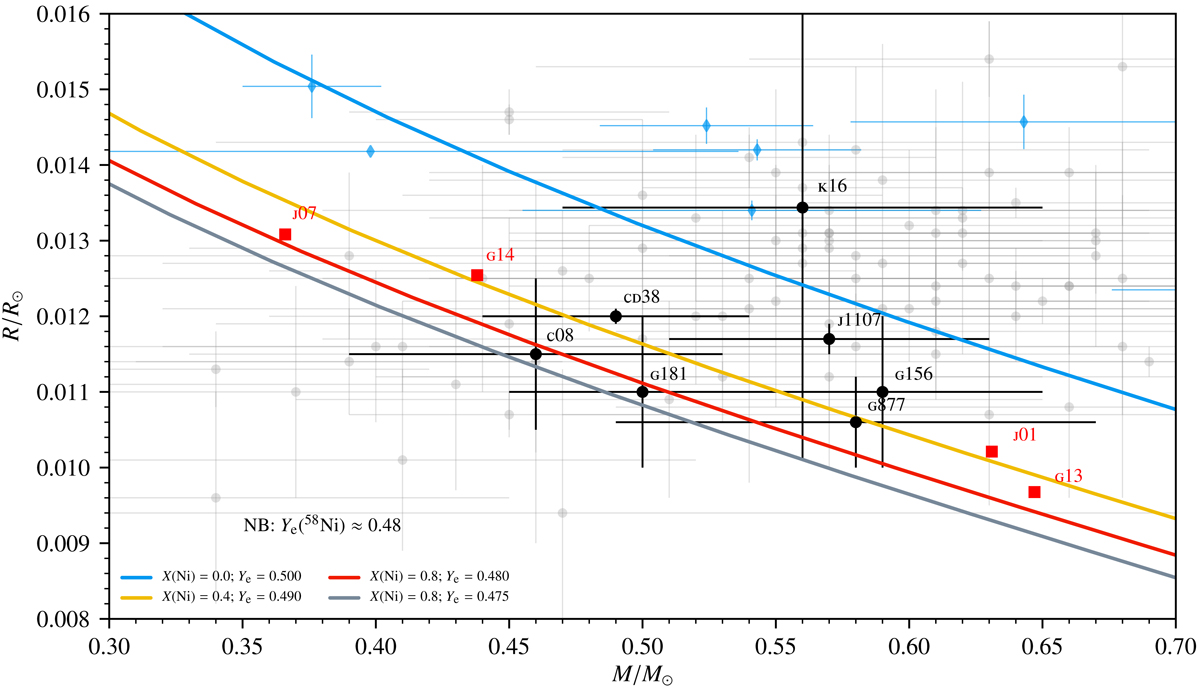
Theoretical white dwarf mass–radius relations for the surviving ONeFe bound remnants of the high-density ONe deflagration simulations by Jones et al. (2016a). The four curves are for different ONeFe white dwarfs with Fe-group mass fractions X(Ni) represented by 56Ni and 64Ni mixed in a ratio to give the corresponding average Ye for the white dwarf. The blue curve is for pure ONe white dwarfs. The grey points are the measurements from Bédard et al. (2017), the blue points are measurements from Joyce et al. (2018) which have vastly improved distance estimates from Gaia, and the black points are individual objects that have proposed as being either Fe white dwarfs or having Fe cores: Provencal et al. (1998, CD38-10980; G181-B58; G156-64) Catalán et al. (2008, C08; WD0433+270), Kepler et al. (2016, K16; SDSS J124043.01), Bédard et al. (2017, J1107; SCR J1107–342). The red points are the bound remnants from the simulations by Jones et al. (2016a) and this work (see Table 2).
Current usage metrics show cumulative count of Article Views (full-text article views including HTML views, PDF and ePub downloads, according to the available data) and Abstracts Views on Vision4Press platform.
Data correspond to usage on the plateform after 2015. The current usage metrics is available 48-96 hours after online publication and is updated daily on week days.
Initial download of the metrics may take a while.