Fig. 11.
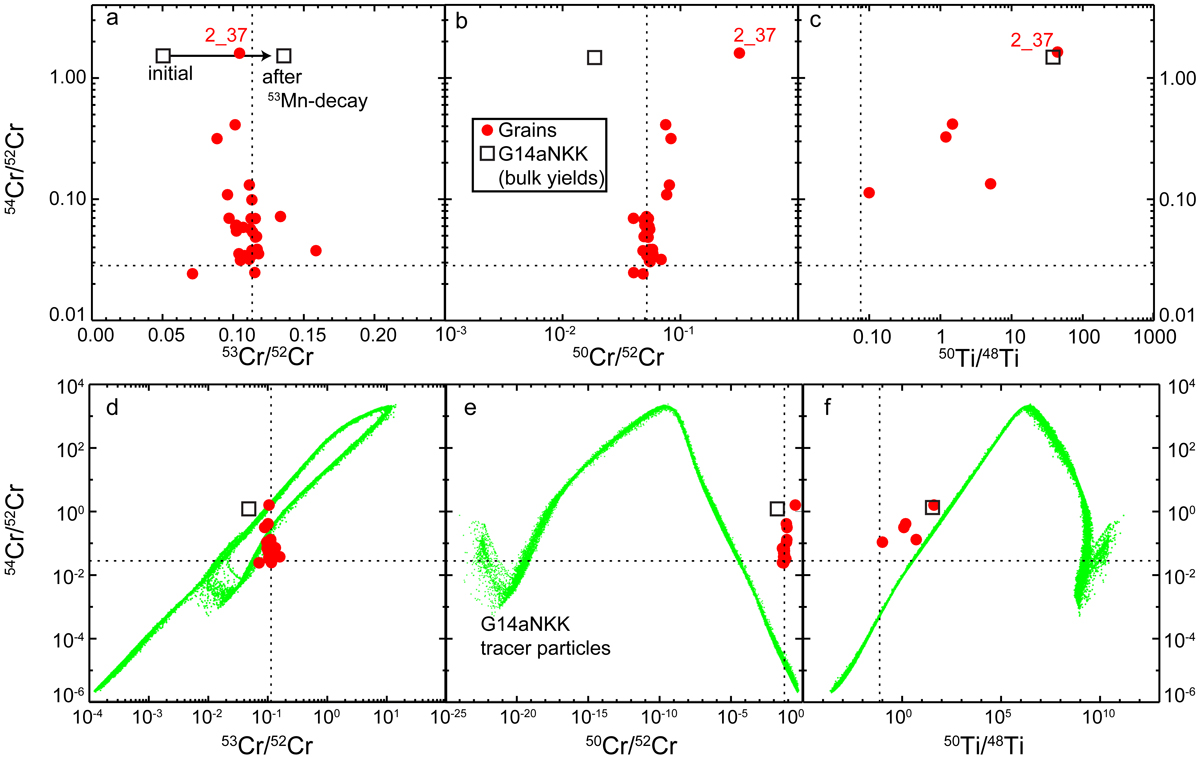
Comparison of isotopic ratios measured in pre-solar oxide grains (Dauphas et al. 2010; Qin et al. 2011; Nittler et al. 2018) compared to predictions of G14a simulation with NNK weak reaction rates. Open squares are bulk yields of G14aNKK, while green points (lower panels) are individual tracer particles. We note that the scales are different in the upper and lower panels. The dashed lines indicate solar ratios. Grain 50Ti/48Ti ratios are calculated on the assumption that all measured signal at mass 50 is due to 50Ti (i.e., 50Cr/52Cr = 0; Nittler et al. 2018).
Current usage metrics show cumulative count of Article Views (full-text article views including HTML views, PDF and ePub downloads, according to the available data) and Abstracts Views on Vision4Press platform.
Data correspond to usage on the plateform after 2015. The current usage metrics is available 48-96 hours after online publication and is updated daily on week days.
Initial download of the metrics may take a while.