Fig. 8.
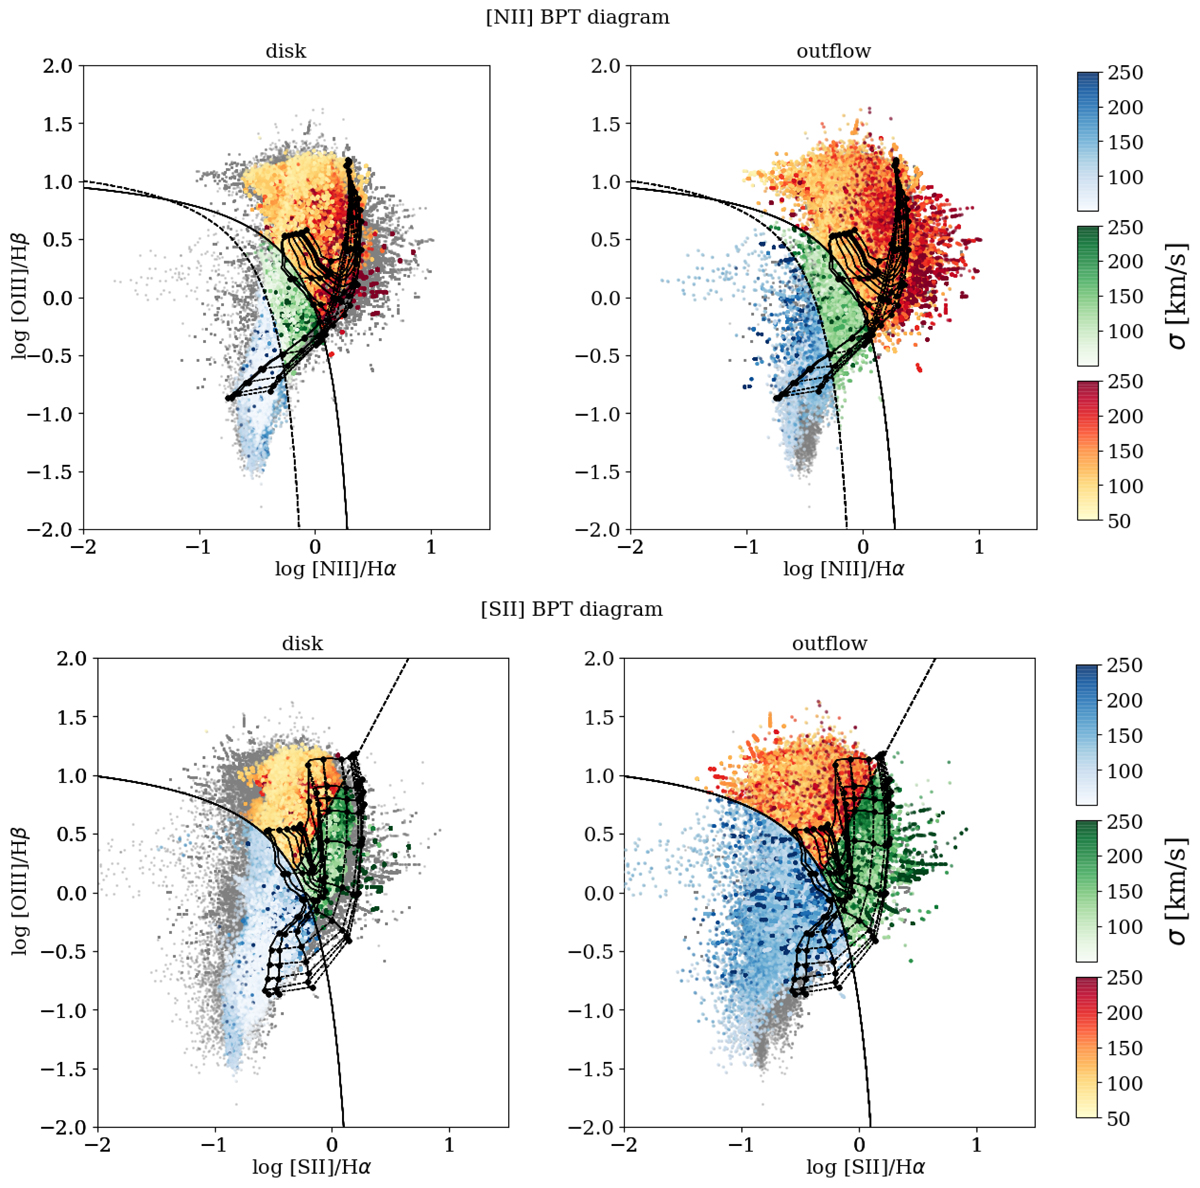
[N II]- and [S II]-BPT diagrams for the disc and outflow components, as shown in Fig. 6, colour-coded as a function of the [O III] velocity dispersion (darker shades means higher σ[O III]). The grid of shock models taken from Allen et al. (2008) comprises shock velocities in the range vs = 100 − 1000 km s−1 (horizontally increasing) and magnetic parameters B/n1/2 = 10−2 − 10 μG cm3/2 (vertically increasing). The black dotted line is the Kewley et al. (2006) boundary between Seyferts and LI(N)ERs.
Current usage metrics show cumulative count of Article Views (full-text article views including HTML views, PDF and ePub downloads, according to the available data) and Abstracts Views on Vision4Press platform.
Data correspond to usage on the plateform after 2015. The current usage metrics is available 48-96 hours after online publication and is updated daily on week days.
Initial download of the metrics may take a while.