Fig. 7.
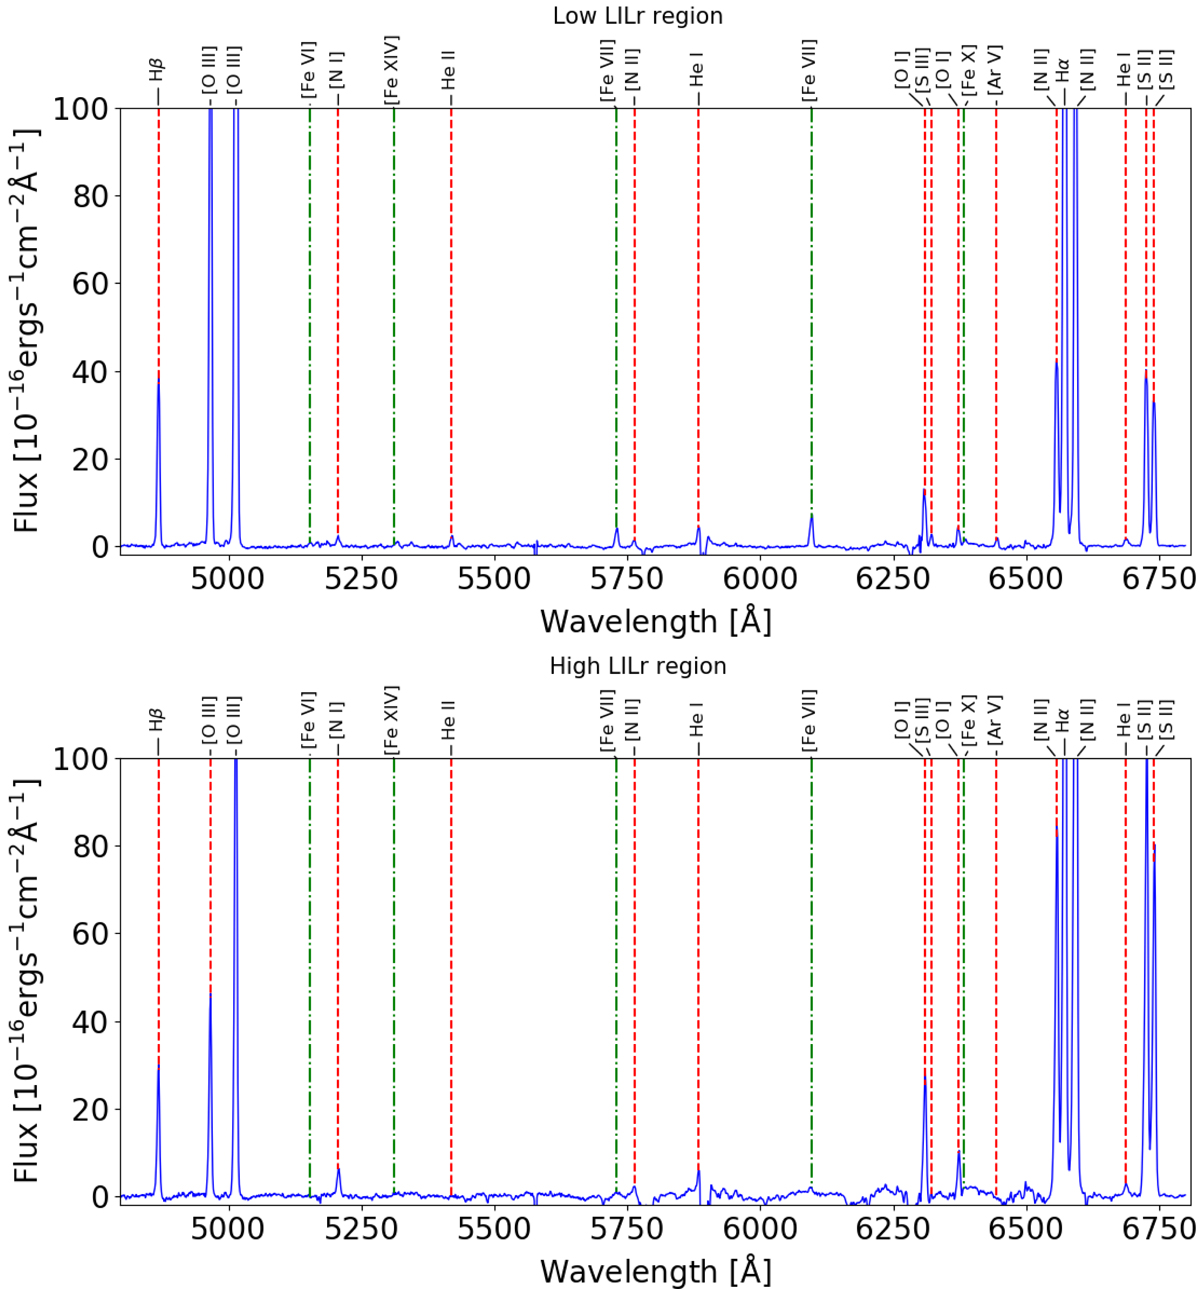
Top panel: spectrum of the region characterised by log([N II]/Hα) < − 0.2 and log([S II]/Hα) < − 0.4 in Circinus, corresponding to the innermost regions of the outflowing cone. Bottom panel: spectrum of the region characterised by log([N II]/Hα) > 0.1 and log([S II]/Hα) > 0 in Circinus, mainly tracing the edges of the north-western outflowing cone. High-ionisation coronal lines (in green) are observed almost exclusively in the low LILr region, supporting a scenario where the inner parts of the outflowing gas in this galaxy are in optically thin highly ionised regions.
Current usage metrics show cumulative count of Article Views (full-text article views including HTML views, PDF and ePub downloads, according to the available data) and Abstracts Views on Vision4Press platform.
Data correspond to usage on the plateform after 2015. The current usage metrics is available 48-96 hours after online publication and is updated daily on week days.
Initial download of the metrics may take a while.