Fig. 6.
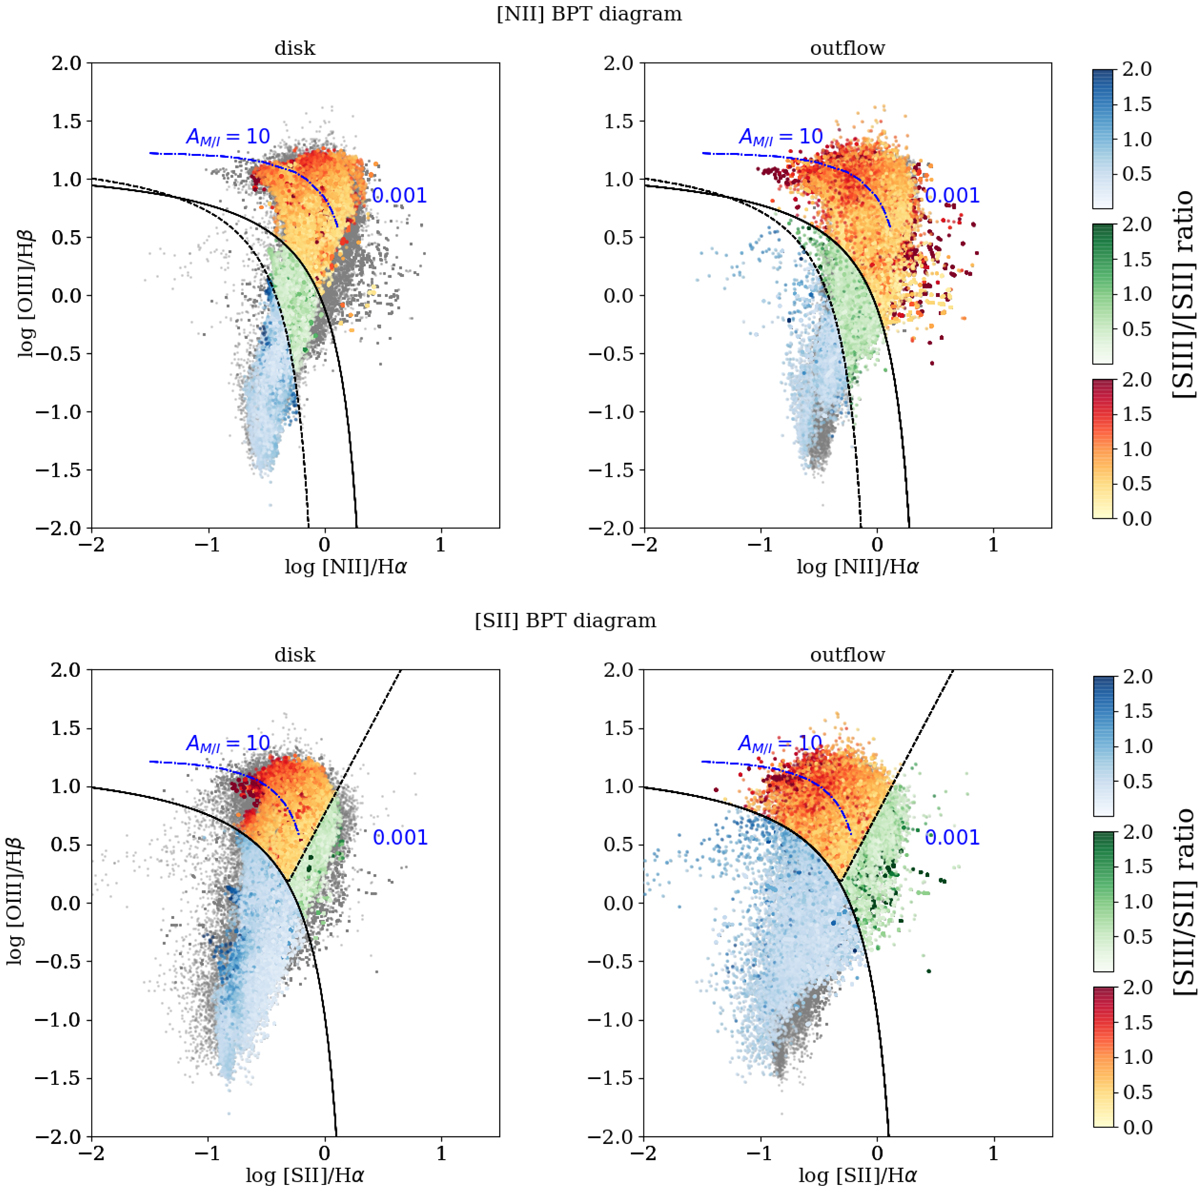
[N II]- and [S II]-BPT diagrams for the disc and outflow components, on the left and the right respectively, of all the MAGNUM galaxies, apart from NGC 1068, colour-coded as follows: shades of blue for SF, green for intermediate regions in the [N II]-BPT and LI(N)ER in the [S II]-BPT, and red for AGN-like ionising spectra, as a function of the [S III]/[S II] line ratio (darker shades means higher [S III]/[S II] values). The black dashed curve is the boundary between star-forming galaxies and AGN defined by Kauffmann et al. (2003), while the black solid line is the theoretical upper limit on SF line ratios found by Kewley et al. (2001). The dash-dotted blue curve represents the Binette AM/I-sequence, dominated by MB clouds in the upper left region and by IB clouds going towards higher LILrs. The black dotted line is the Kewley et al. (2006) boundary between Seyferts and LI(N)ERs. The black dots in the BPTs are all the spaxels taken into account (both of the disc and of the outflow component) with a S/N > 3 for the line fluxes involved.
Current usage metrics show cumulative count of Article Views (full-text article views including HTML views, PDF and ePub downloads, according to the available data) and Abstracts Views on Vision4Press platform.
Data correspond to usage on the plateform after 2015. The current usage metrics is available 48-96 hours after online publication and is updated daily on week days.
Initial download of the metrics may take a while.