Fig. 4.
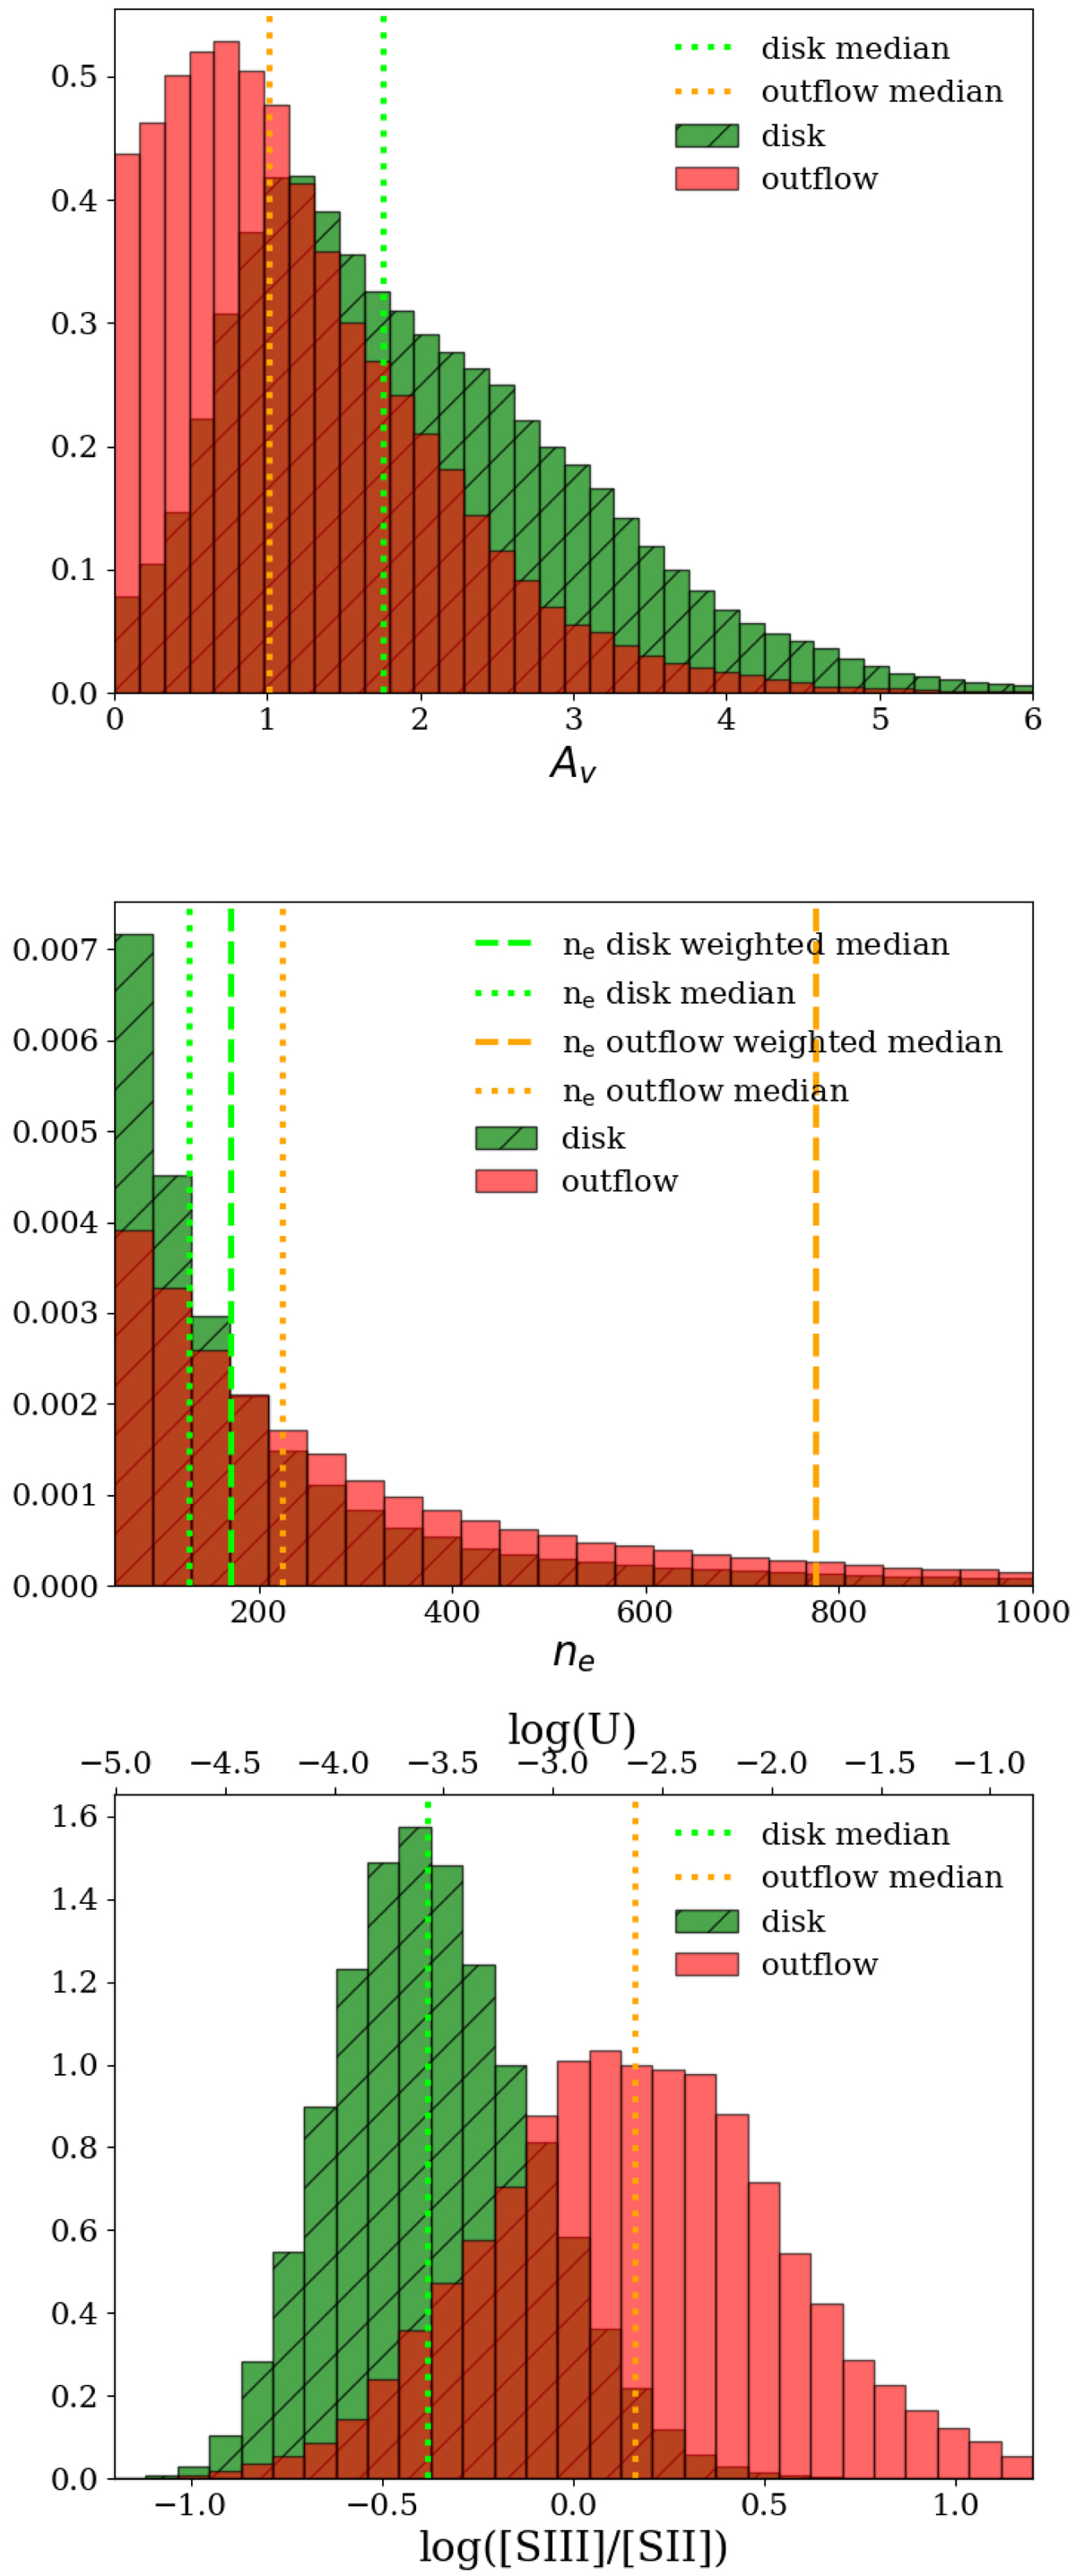
Comparison of the disc (green with stripes) and outflow (red) component distributions for all the MAGNUM galaxies in terms of visual extinction AV, density ne, and log([S III]/[S II]) (top, middle, and bottom panel, respectively). The two distributions are normalised such that the integral over the range is 1. For each velocity bin, we take into account only the spaxels with a S/N > 5 for the emission lines involved. The light green and orange dotted lines represent the median of the disc and outflow distributions, respectively. The dashed lines in the central panel represent the median value weighted on the [S II] line flux. The top x-axis of the bottom panel translates the [S III]/[S II] ratio into log(U), following the relation provided by Díaz et al. (2000).
Current usage metrics show cumulative count of Article Views (full-text article views including HTML views, PDF and ePub downloads, according to the available data) and Abstracts Views on Vision4Press platform.
Data correspond to usage on the plateform after 2015. The current usage metrics is available 48-96 hours after online publication and is updated daily on week days.
Initial download of the metrics may take a while.