Fig. 2.
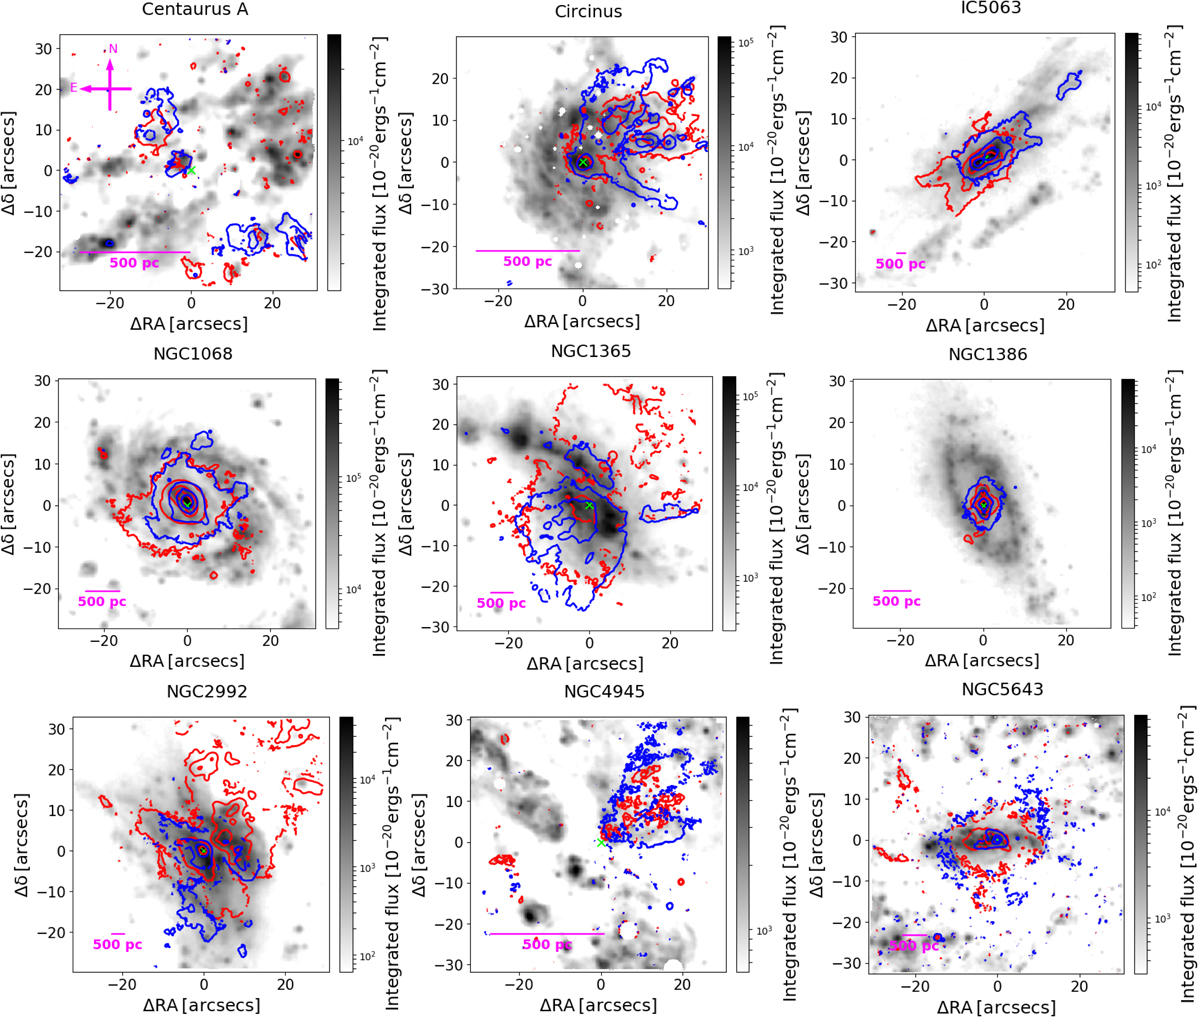
Hα disc component flux maps (not corrected for dust reddening) for all the galaxies, namely Centaurus A, Circinus, IC 5063, NGC 1068, NGC 1365, NGC 1386, NGC 2992, NGC 4945, and NGC 5643. [O III]λ5007 outflow component flux contours are superimposed for all the galaxies. The blueshifted and redshifted outflow emission (in blue and red, respectively) is often extended in a kiloparsec-scale conical or biconical distribution. For each velocity bin, we show only the spaxels with a S/N > 5. The magenta bar represents a physical scale of ∼500 pc. East is to the left, as shown in the first image on the left. The white circular regions are masked foreground stars. The cross marks the position either of the Type 1 nucleus (i.e. peak of the broad Hα emission), if present, or the peak of the continuum in the wavelength range 6800 − 7000 Å.
Current usage metrics show cumulative count of Article Views (full-text article views including HTML views, PDF and ePub downloads, according to the available data) and Abstracts Views on Vision4Press platform.
Data correspond to usage on the plateform after 2015. The current usage metrics is available 48-96 hours after online publication and is updated daily on week days.
Initial download of the metrics may take a while.