Fig. D.3.
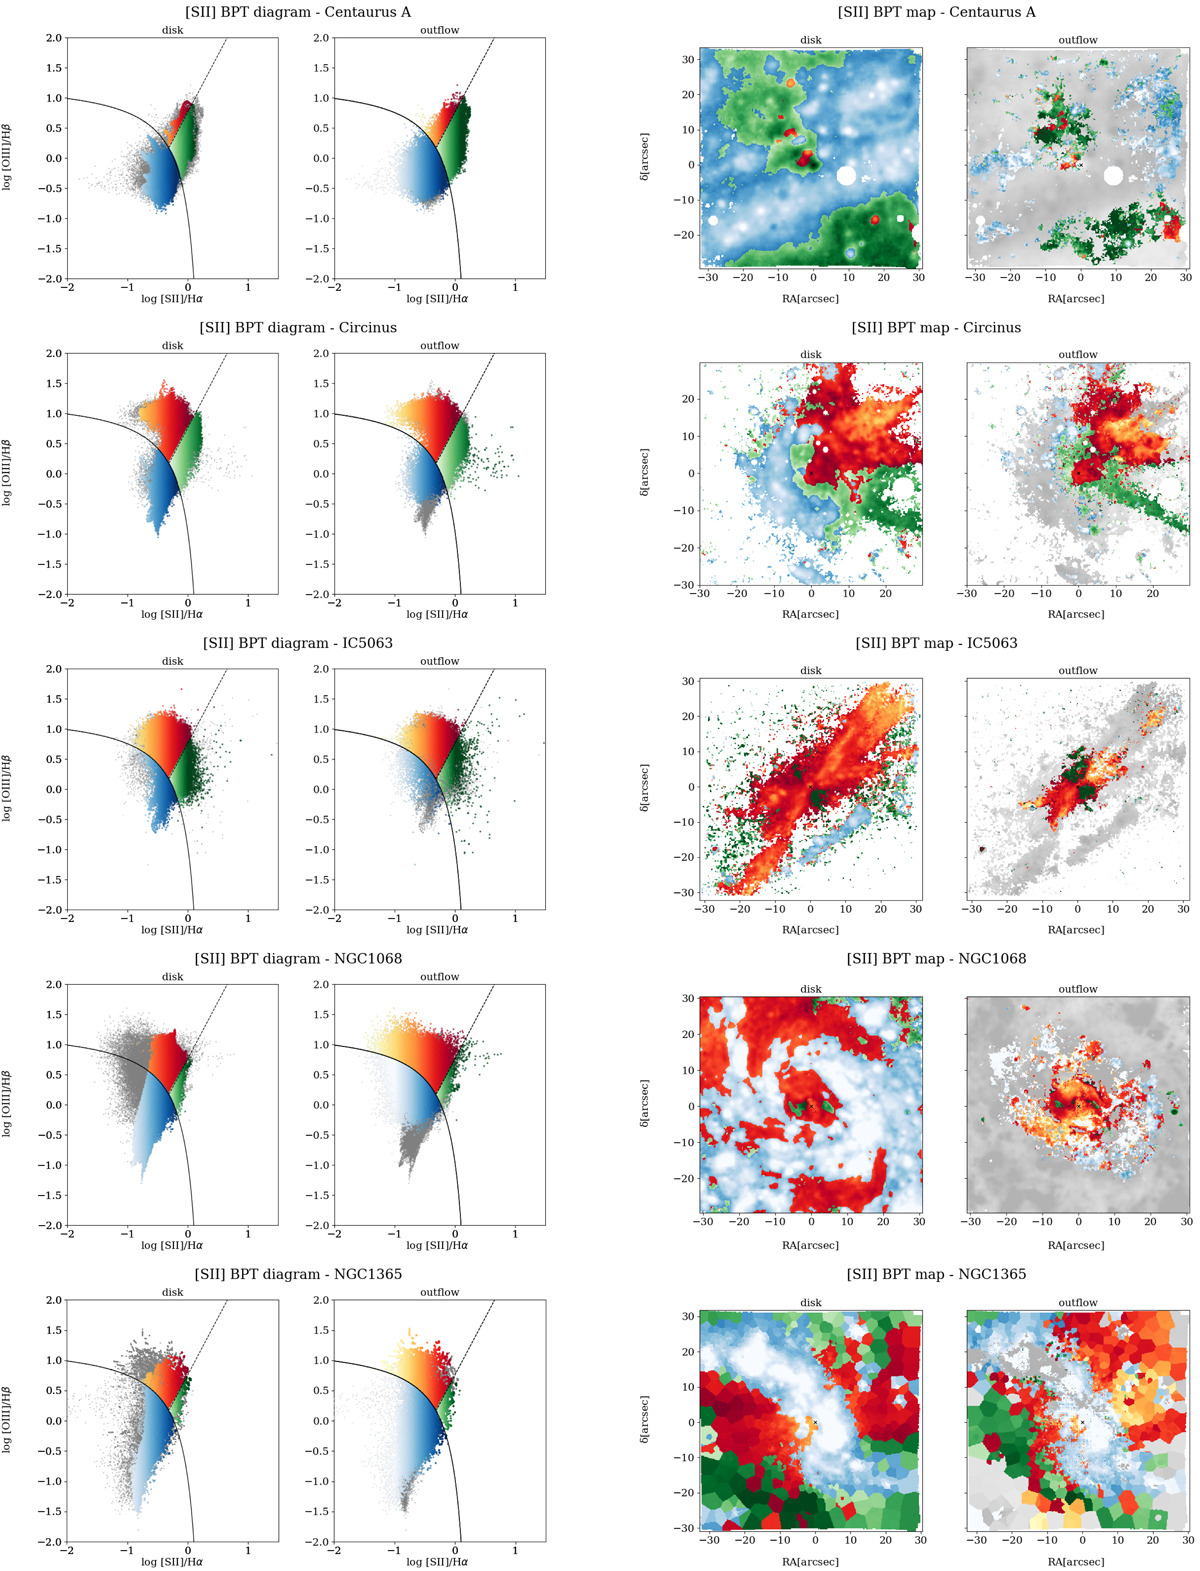
Left panels: [S II]-BPT diagrams for the disc and outflow components, on the left and the right respectively, of Centaurus A, IC 5063, NGC 1068 and NGC 1365, colour-coded as follows: shades of blue for SF, green for LI(N)ER, and red for AGN-like ionising spectra, as a function of the [S II]/Hα line ratio (darker shades means higher [S II]/Hα). The black solid curve is the theoretical upper limit on SF line ratios found by Kewley et al. (2001). The black dotted line is the Kewley et al. (2006) boundary between Seyferts and LI(N)ERs. Right panels: [S II]-BPT maps, colour-coded according to the BPT classification. In the background of all the pictures (black dots in the BPTs and shaded grey in the corresponding maps), are shown the disc and outflow component together. For each velocity bin, we select only the spaxels with a S/N > 5 for all the flux line ratios.
Current usage metrics show cumulative count of Article Views (full-text article views including HTML views, PDF and ePub downloads, according to the available data) and Abstracts Views on Vision4Press platform.
Data correspond to usage on the plateform after 2015. The current usage metrics is available 48-96 hours after online publication and is updated daily on week days.
Initial download of the metrics may take a while.