Fig. 9
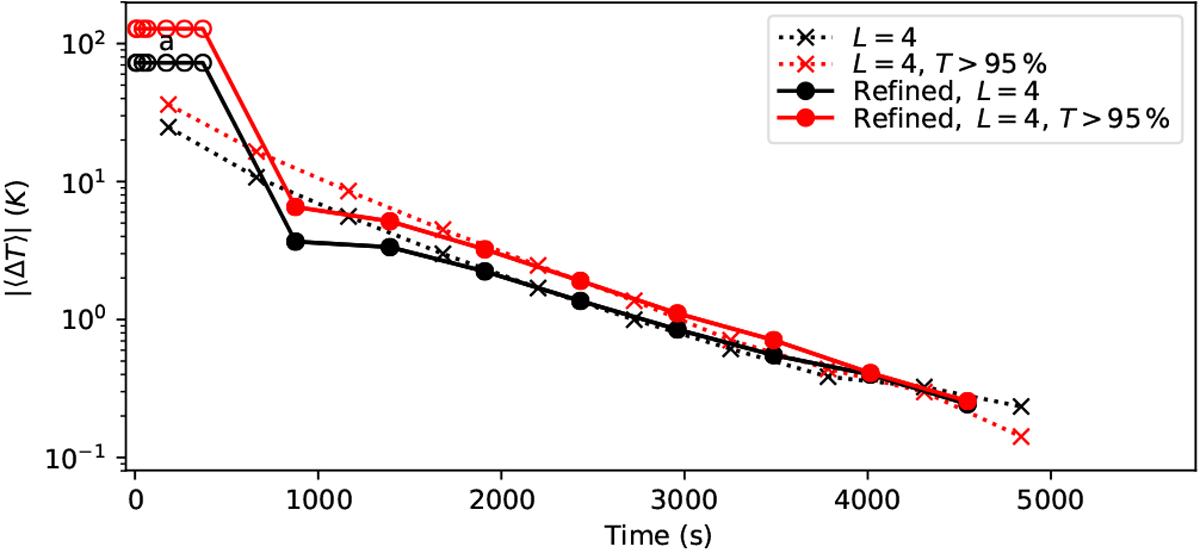
Convergence of temperatures for basic runs with the nL = 4 model (dashed lines) and with run-time refinement of the spatial grid from nL = 1 to nL = 4 (solid lines). The results are shown for the average of all L = 4 cells (black lines) and for the average of 5% of the warmest L = 4 cells (red lines). Convergence |ΔT| is measured as the difference from a run with 40 iterations and the same nP. In the case of run-time refinement, the open symbols correspond to initial iterations with nL < 4; they are drawn at |ΔT| = 100 K, and only indicate the run times of those steps.
Current usage metrics show cumulative count of Article Views (full-text article views including HTML views, PDF and ePub downloads, according to the available data) and Abstracts Views on Vision4Press platform.
Data correspond to usage on the plateform after 2015. The current usage metrics is available 48-96 hours after online publication and is updated daily on week days.
Initial download of the metrics may take a while.