Fig. 7
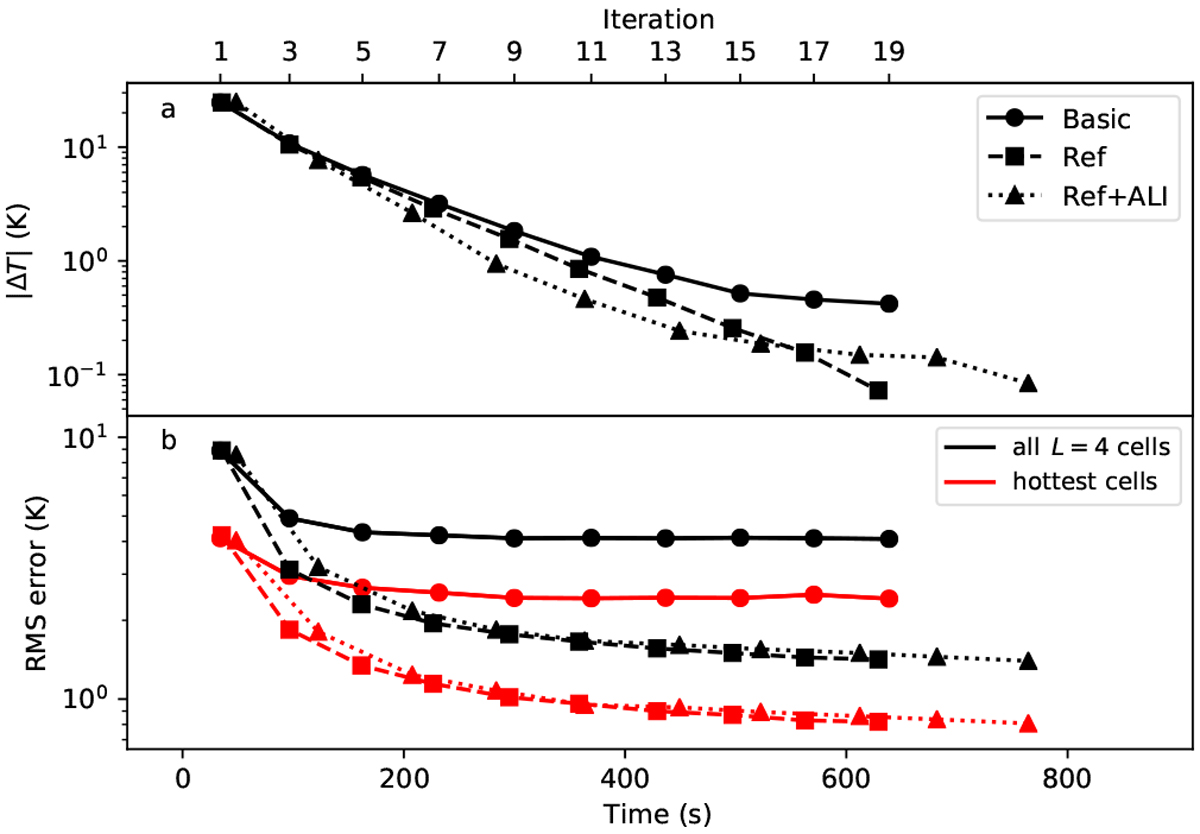
Results for the nL = 4 model when using a reference field. All statistics refer to the average dust temperature of the cells on the highest L = 4 level of the grid hierarchy. Panel a: temperature error relative to the solution obtained with the same setup after 20 iterations. Panel b: rms temperature difference between two independent runs, the red curves showing these separately for 5% of the cells with the highest temperatures. Circles stand for the basic calculations (no ALI and no reference field), squares to a reference field runs, and triangles to the combination of the reference field and ALI techniques. Values are plotted against the run time and the upper x-axis shows the corresponding number of iterations in the basic run.
Current usage metrics show cumulative count of Article Views (full-text article views including HTML views, PDF and ePub downloads, according to the available data) and Abstracts Views on Vision4Press platform.
Data correspond to usage on the plateform after 2015. The current usage metrics is available 48-96 hours after online publication and is updated daily on week days.
Initial download of the metrics may take a while.