Fig. 5
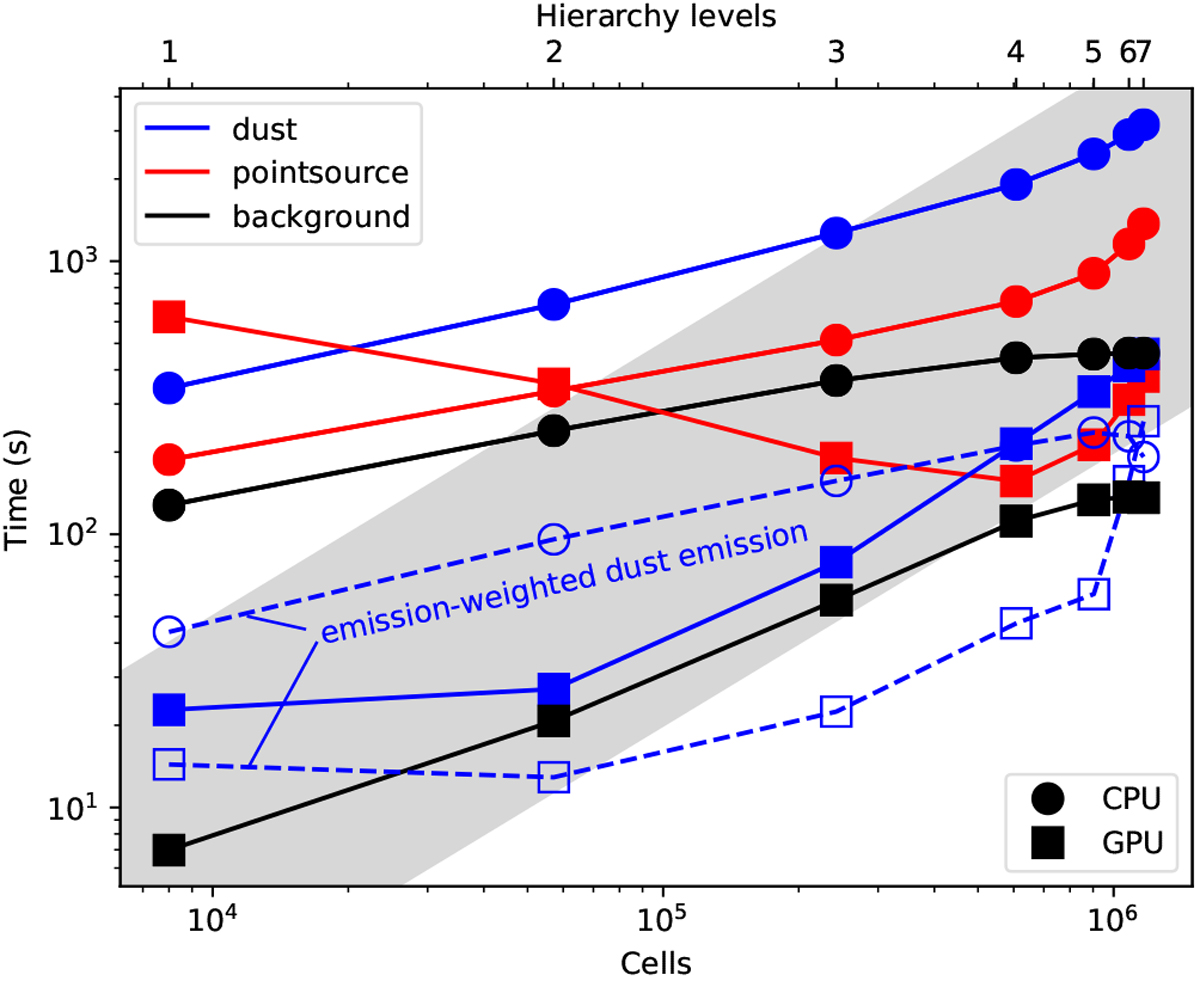
Dependence of run times on the maximum refinement. The colours correspond to simulations of the radiation from a point source (red), external background (black), and dust re-emission (blue). For dust emission, the dashed lines and open symbols correspond to a run using emission weighting. The CPU run times are plotted with circles and the GPU run times with squares. The shading indicates the trend for run times proportional to the number of cells.
Current usage metrics show cumulative count of Article Views (full-text article views including HTML views, PDF and ePub downloads, according to the available data) and Abstracts Views on Vision4Press platform.
Data correspond to usage on the plateform after 2015. The current usage metrics is available 48-96 hours after online publication and is updated daily on week days.
Initial download of the metrics may take a while.