Fig. 4
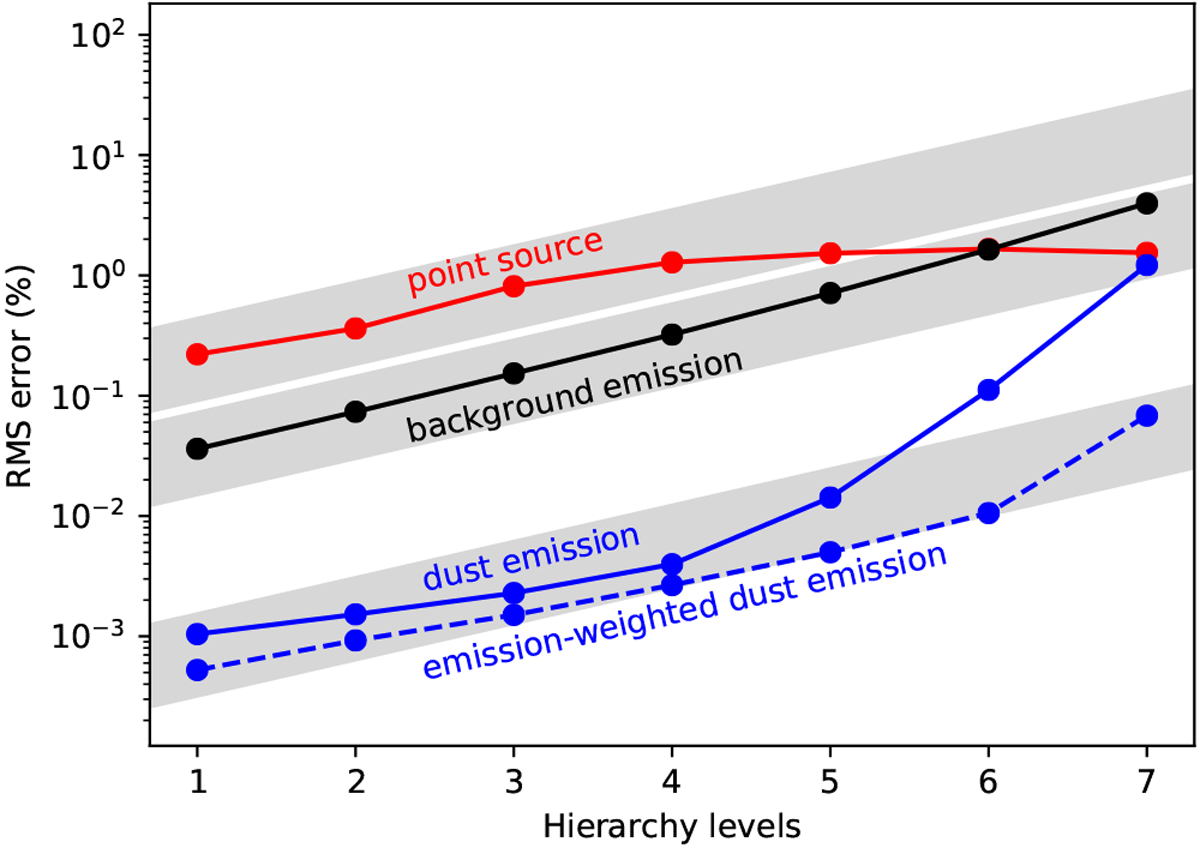
Error of the computed dust temperatures as a function of the grid hierarchy in a model with nL = 7. From top to bottom panels: curves correspond to simulations of a point source (red curve), heating by background radiation (black curve), and simulations of dust emission when the contribution of the previous radiation sources is kept constant (blue curves). The solid and dashed lines correspond to the default and the emission-weighted simulations, respectively. The shaded regions are used to illustrate the expected 2level dependence of the noise. All calculations were done with 1.8 × 10⁷ photon packages per frequency.
Current usage metrics show cumulative count of Article Views (full-text article views including HTML views, PDF and ePub downloads, according to the available data) and Abstracts Views on Vision4Press platform.
Data correspond to usage on the plateform after 2015. The current usage metrics is available 48-96 hours after online publication and is updated daily on week days.
Initial download of the metrics may take a while.