Fig. 3
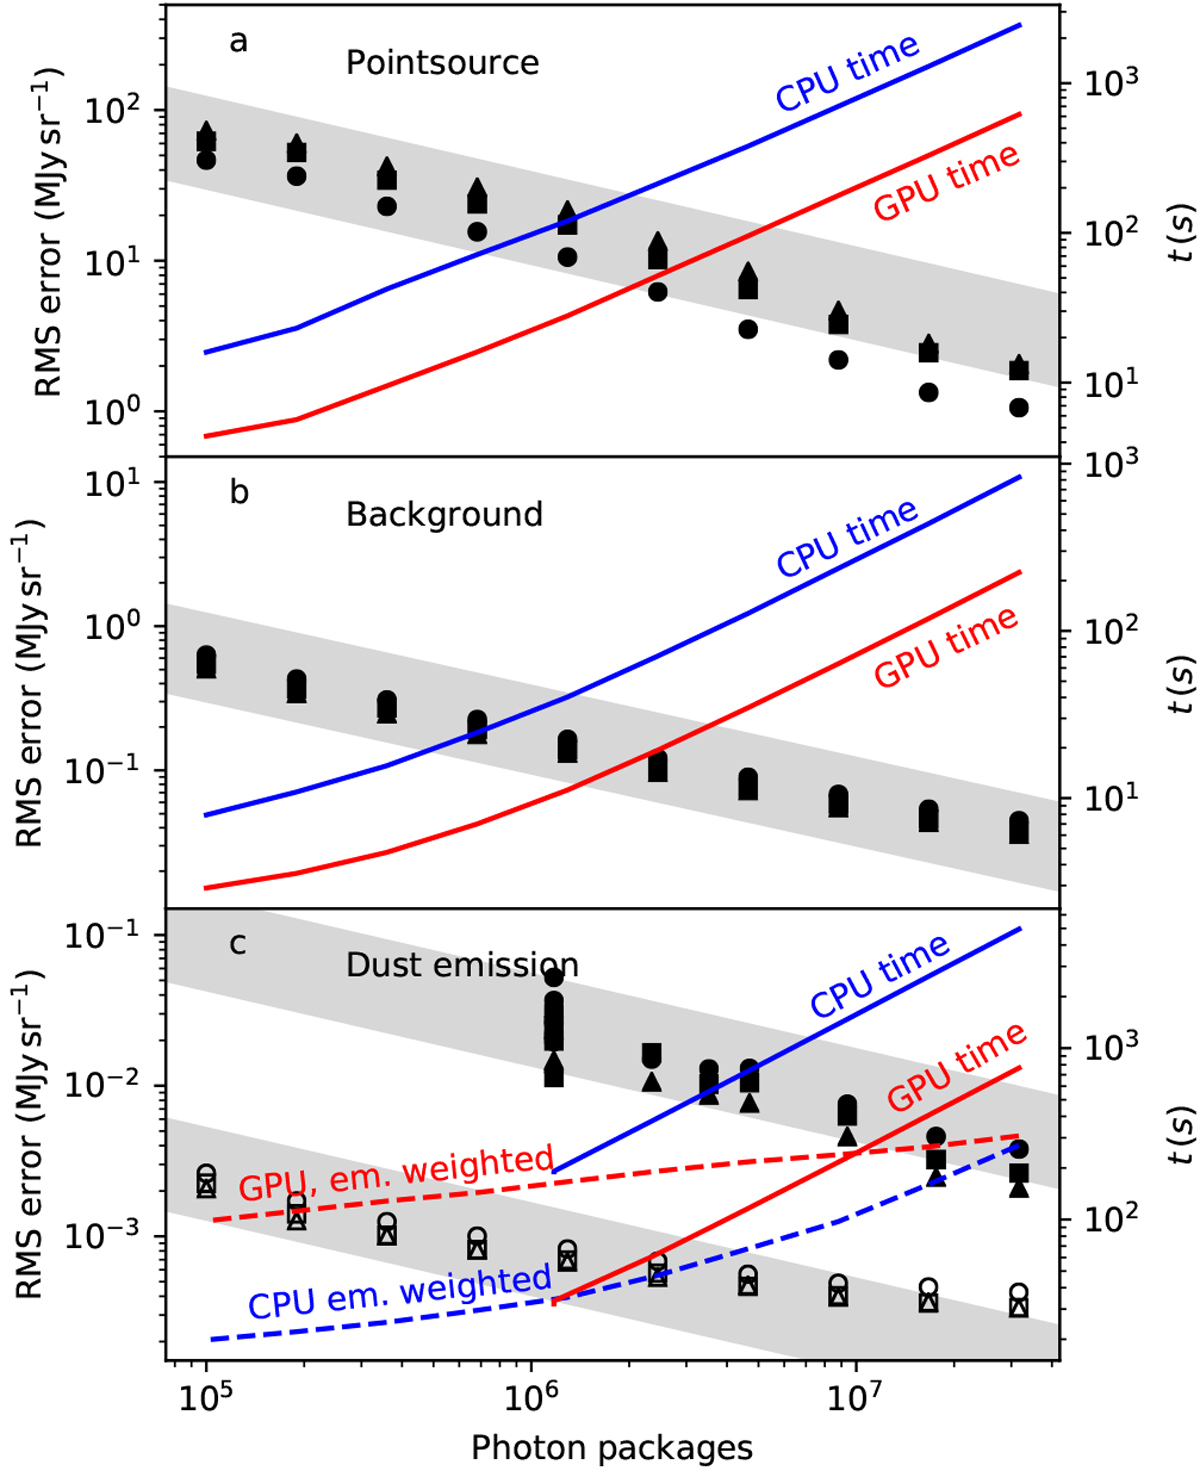
Test with high-resolution model in the case of only a point source (panel a) or only background radiation (panel b), or including both as constant radiation field components to examine the noise in the simulation of dust re-emission. The rms errors as a function of the number of photon packages are shown with black symbols. The circles, squares, and triangles correspond to maps calculated toward three orthogonal directions. The shading shows the expected N−1∕2 convergence.The lines and right-hand y-axis indicate the run times for CPU (blue) and GPU (red). Panel c: open symbols and dashed lines correspond to an alternative run with emission weighting.
Current usage metrics show cumulative count of Article Views (full-text article views including HTML views, PDF and ePub downloads, according to the available data) and Abstracts Views on Vision4Press platform.
Data correspond to usage on the plateform after 2015. The current usage metrics is available 48-96 hours after online publication and is updated daily on week days.
Initial download of the metrics may take a while.