Fig. 2
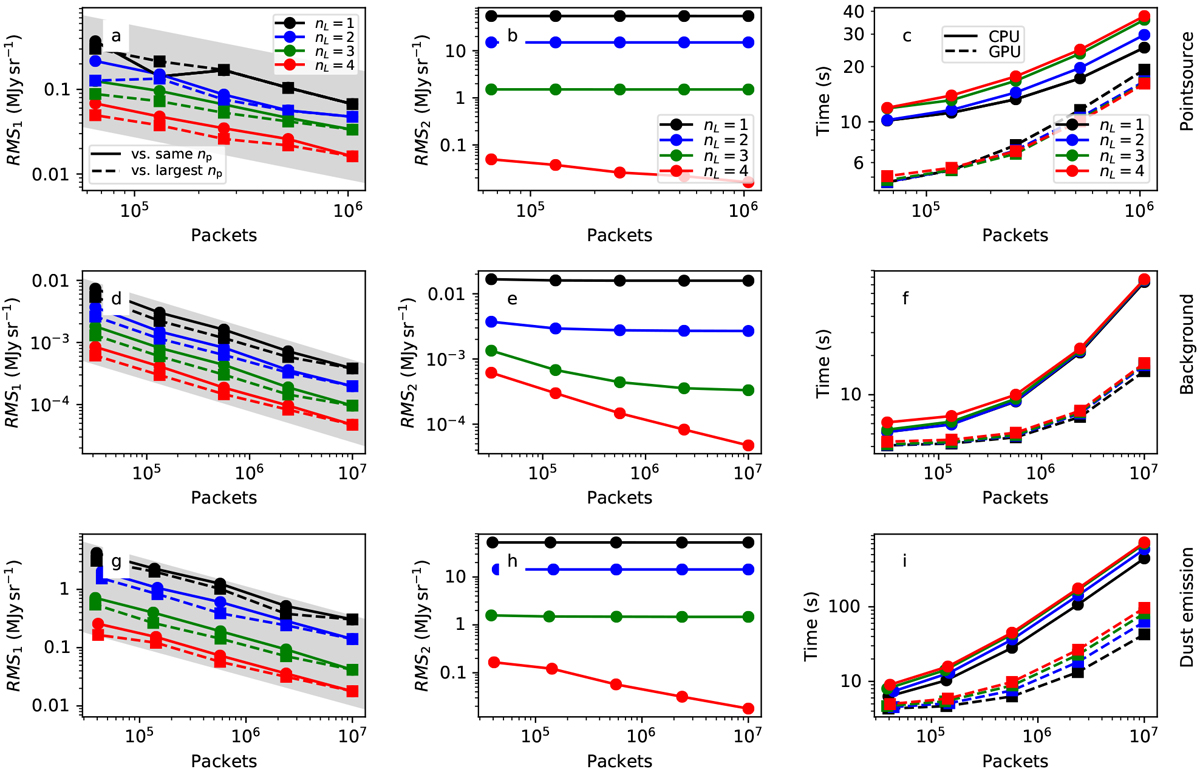
Noise and run times as a function of the number of photon packages for a small spherically symmetric test model. Results are shown for simulations of a point source (panels a–c), a diffuse background (panels d–f), and the dust emission from the model volume (panels g–i). First column: rms noise of the 100 μm map as thedifference of two identical runs (solid lines) and from the comparison to a run with the same volume discretisation (same nL) but the highest number of photon packages (dashed lines). Shading is used to indicate the expected nP−1∕2 convergence as a function of the number of photon packages. Second column: rms difference to a corresponding run with the highest number of photon packages and the finest spatial discretisation (nL = 5). The wall-clock run times for CPU (solid lines) and GPU (dashed lines) computations are shown in the last column. In each frame, the colours correspond to different values of nL, as indicated in frame c.
Current usage metrics show cumulative count of Article Views (full-text article views including HTML views, PDF and ePub downloads, according to the available data) and Abstracts Views on Vision4Press platform.
Data correspond to usage on the plateform after 2015. The current usage metrics is available 48-96 hours after online publication and is updated daily on week days.
Initial download of the metrics may take a while.