Fig. B.1
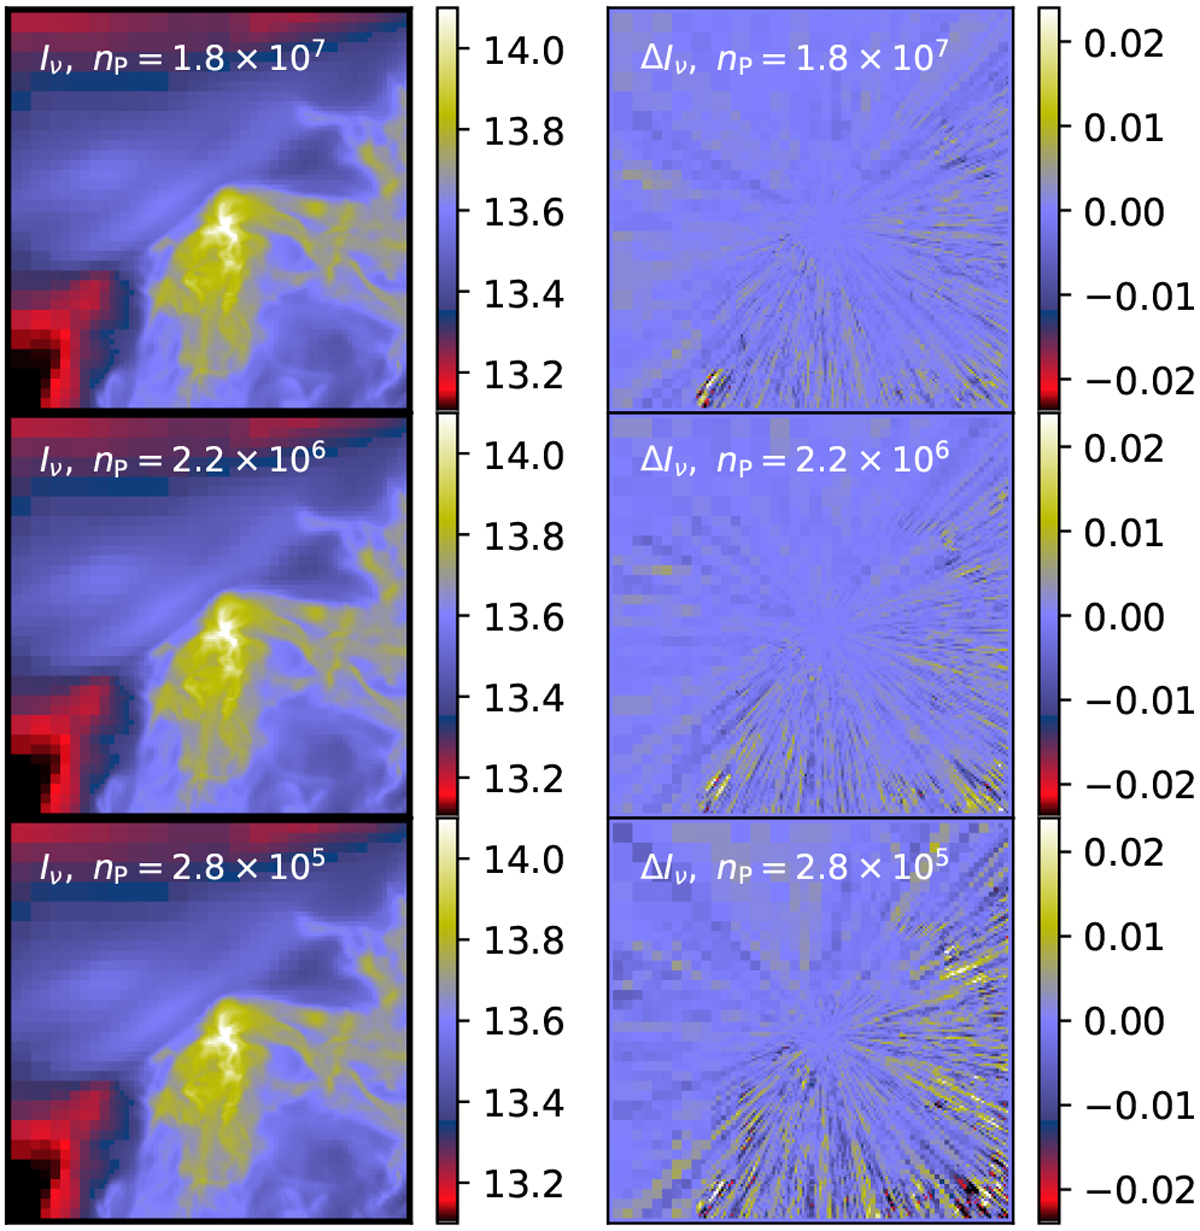
Surface-brightness maps at 100 μm for the final iteration of the non-ALI runs of Fig. 6. The three rows correspond, respectively, to the default nP value of 1.8 × 10⁷ and to nP values smaller by a factor of 8 or 64. Left panels: 100 μm surface brightness Iν(100 μm). Right panels: difference ΔIν(100 μm) between two identical runs. All maps are in units of 108 Jy sr−1.
Current usage metrics show cumulative count of Article Views (full-text article views including HTML views, PDF and ePub downloads, according to the available data) and Abstracts Views on Vision4Press platform.
Data correspond to usage on the plateform after 2015. The current usage metrics is available 48-96 hours after online publication and is updated daily on week days.
Initial download of the metrics may take a while.