Fig. A.3.
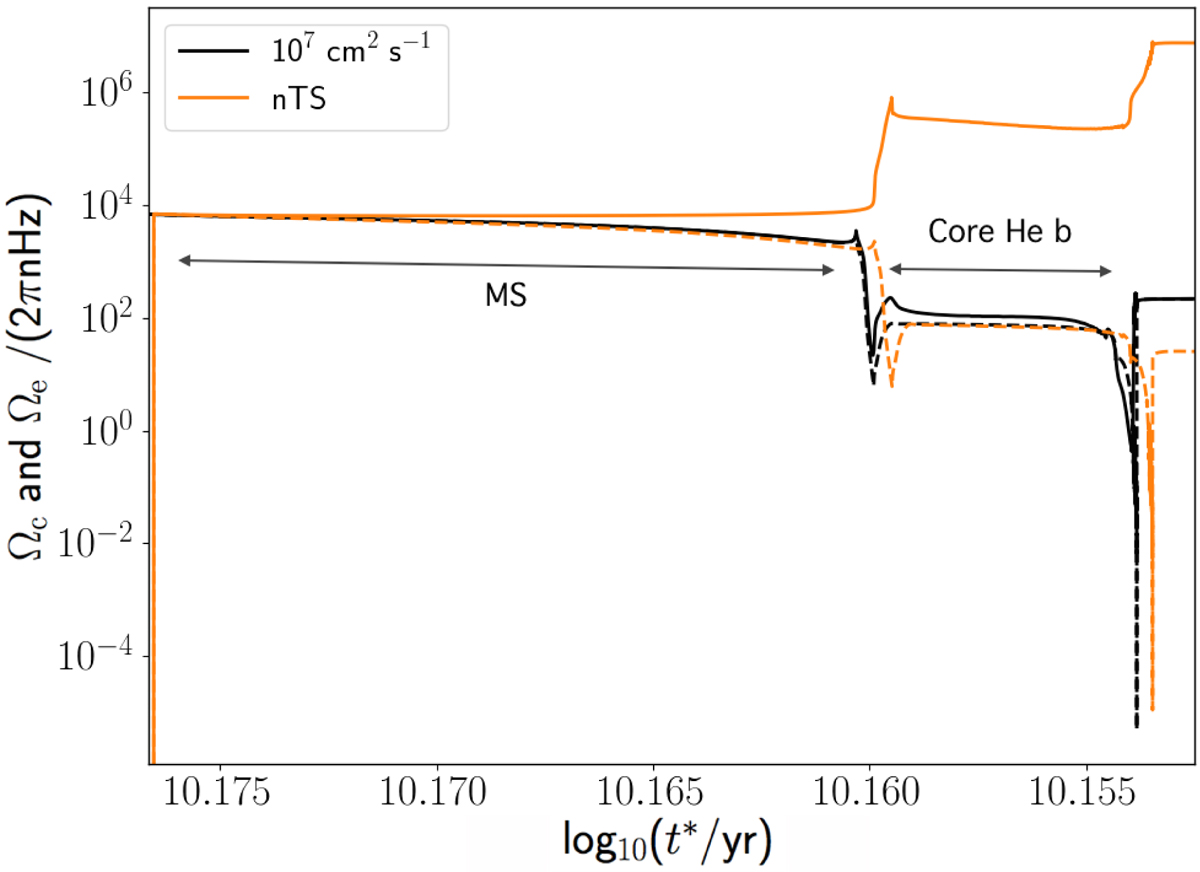
Coupling made visible: shown here is the evolution of core (solid line) and envelope (dashed) rotation rates from the ZAMS to the start of the AGB phase. Differences between the two models become visible at the start of the hydrogen shell burning phase, where the model without TS dynamo and νadd shows that the core and envelope rotation rates move apart, while the model including a νadd of 107 cm2 s−1 shows the rotation rates are coupled.
Current usage metrics show cumulative count of Article Views (full-text article views including HTML views, PDF and ePub downloads, according to the available data) and Abstracts Views on Vision4Press platform.
Data correspond to usage on the plateform after 2015. The current usage metrics is available 48-96 hours after online publication and is updated daily on week days.
Initial download of the metrics may take a while.