Fig. 1.

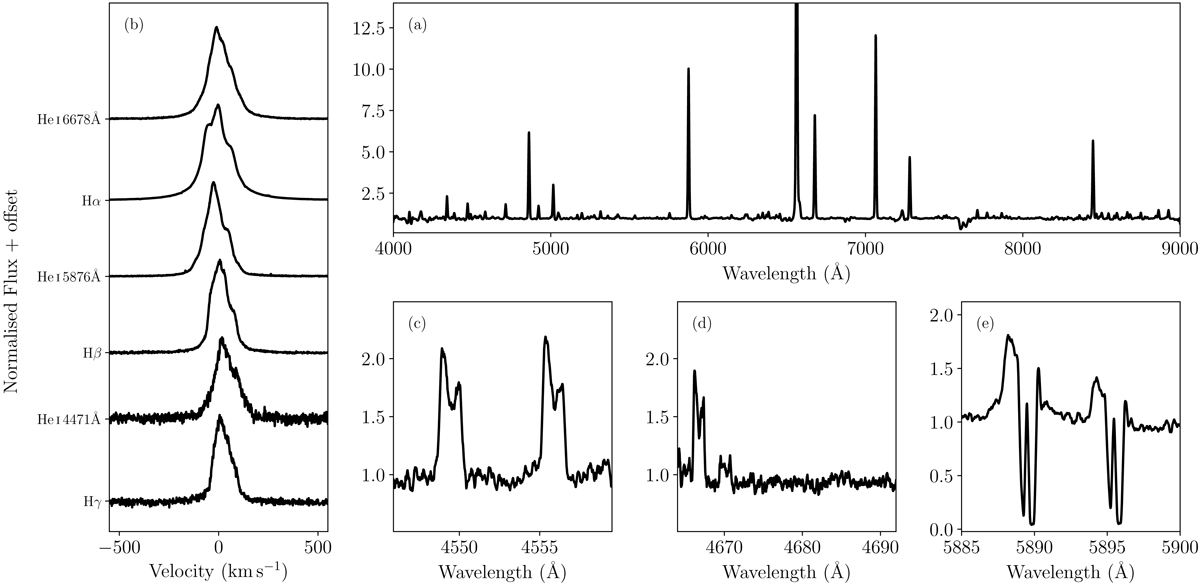
Optical spectrum of CI Cam. Panel a: 4000–9000 Å spectrum of CI Cam, convolved with a Gaussian function to approximately match the resolution of those presented in Fig. 1 of Hynes et al. (2002) to allow for easy comparison. Panel b: original, un-binned line profiles of the stronger hydrogen and helium lines in velocity space, corrected for the systemic velocity of CI Cam, −51 ± 2 km s−1 (Aret et al. 2016). Panel c: systemic redshift corrected 4545–4560 Å region, convolved with a boxcar function with width 13 pixels, corresponding 0.2 Å. Panel d: region around the He II 4686Å line, also redshift corrected and convolved with a boxcar function of width 13 pixels. Panel e: region around the Na D interstellar absorption components, convolved with a boxcar function and with no redshift correction applied.
Current usage metrics show cumulative count of Article Views (full-text article views including HTML views, PDF and ePub downloads, according to the available data) and Abstracts Views on Vision4Press platform.
Data correspond to usage on the plateform after 2015. The current usage metrics is available 48-96 hours after online publication and is updated daily on week days.
Initial download of the metrics may take a while.


