Fig. 4.
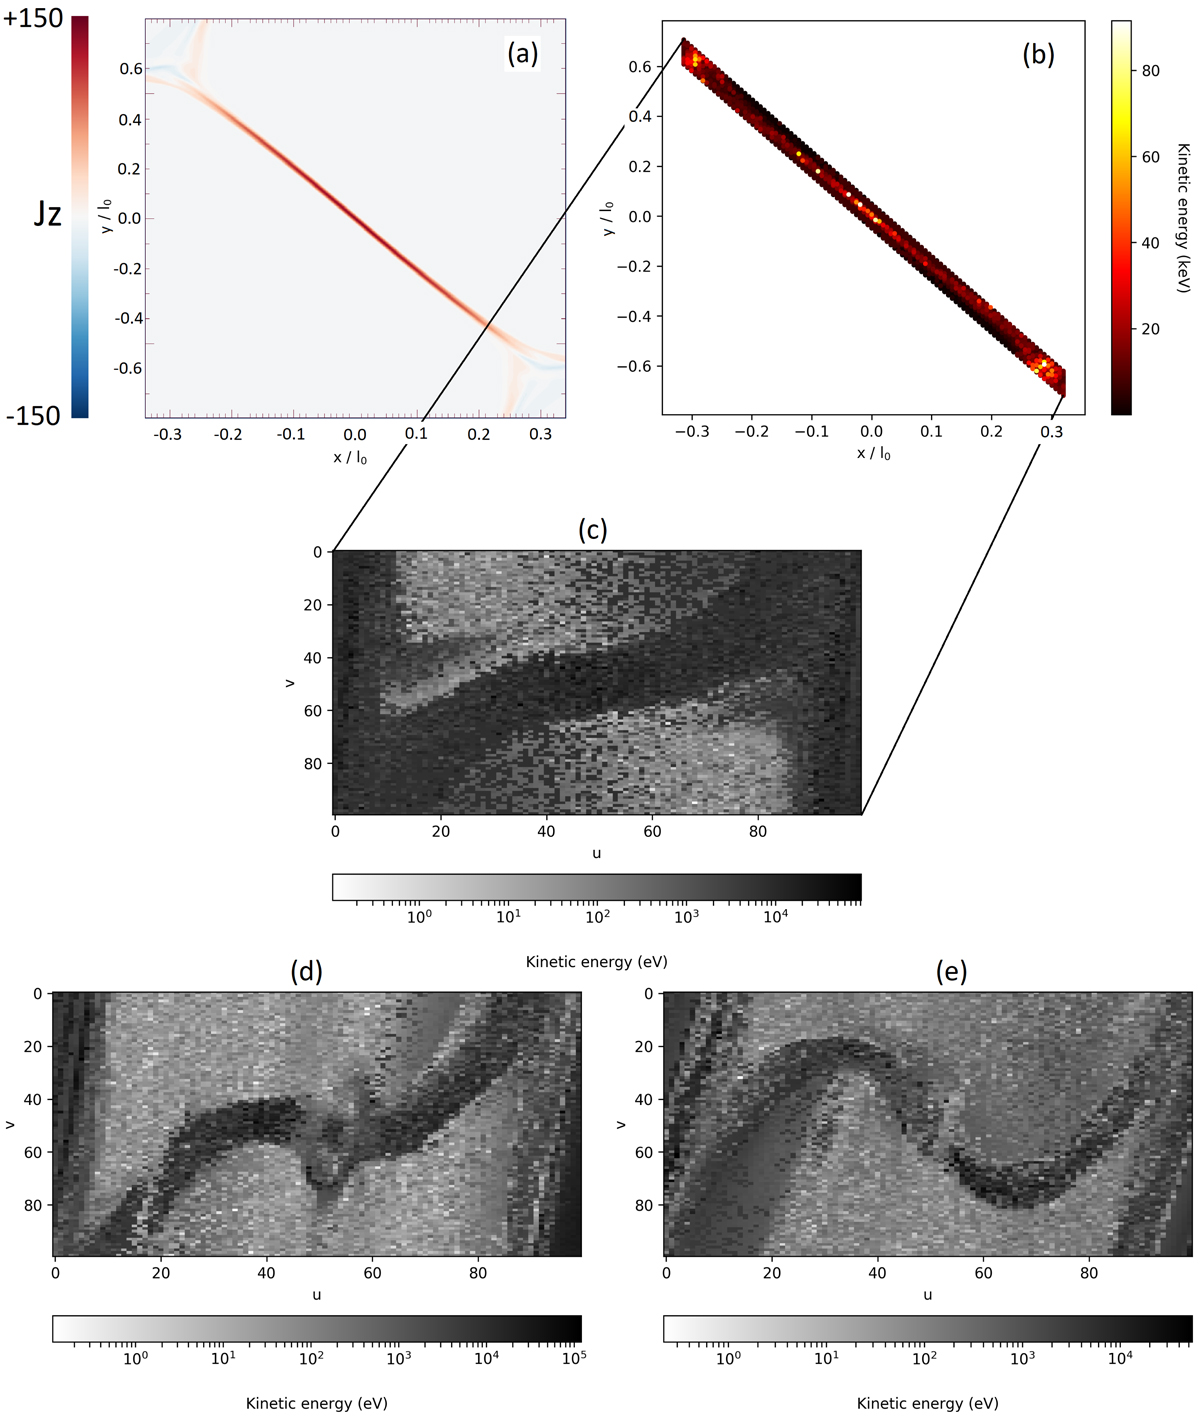
Final kinetic energies for thermal protons initialised in the parallelogram in the centre of the current sheet at z = 0.0 for t = 8 (panel c), t = 16 (panel d), t = 21 (panel e). The parallelogram is composed of 100 × 100 protons (in Cartesian coordinates in panel b) labelled on the axes. This shows the full energy gain plot in comparison to the current sheet shown in panel a, where Jz is the z-component of the current (also at z = 0.0). The plot is then skewed into a rectangle with a log scaling applied to the energy. The dimensions u and υ represent the particle number initialised along the long and short side of the parallelogram, respectively; (0, 0) represents the particle initialised at the top left and (100, 100) represents the particle initialised at the bottom right; see panel c. The corners [x, y] and dimensions of the parallelograms in code units are as follows (starting at the top left corner, going clockwise): panel c: ([−0.32, +0.72],[+0.32, −0.62],[+0.32, −0.72],[−0.32, +0.62]), length (in x) = 0.64, width (in y) = 0.1; panel d: ([−0.29, +1.45],[+0.29, −1.15],[+0.29, −1.45],[−0.29, +1.15]), length (in x) = 0.58, width (in y) = 0.3; and panel e: ([−0.26, +1.90],[+0.26, −1.30],[+0.26, −1.90],[−0.26, +1.30]), length (in x) = 0.52, width (in y) = 0.6.
Current usage metrics show cumulative count of Article Views (full-text article views including HTML views, PDF and ePub downloads, according to the available data) and Abstracts Views on Vision4Press platform.
Data correspond to usage on the plateform after 2015. The current usage metrics is available 48-96 hours after online publication and is updated daily on week days.
Initial download of the metrics may take a while.