Fig. 4.
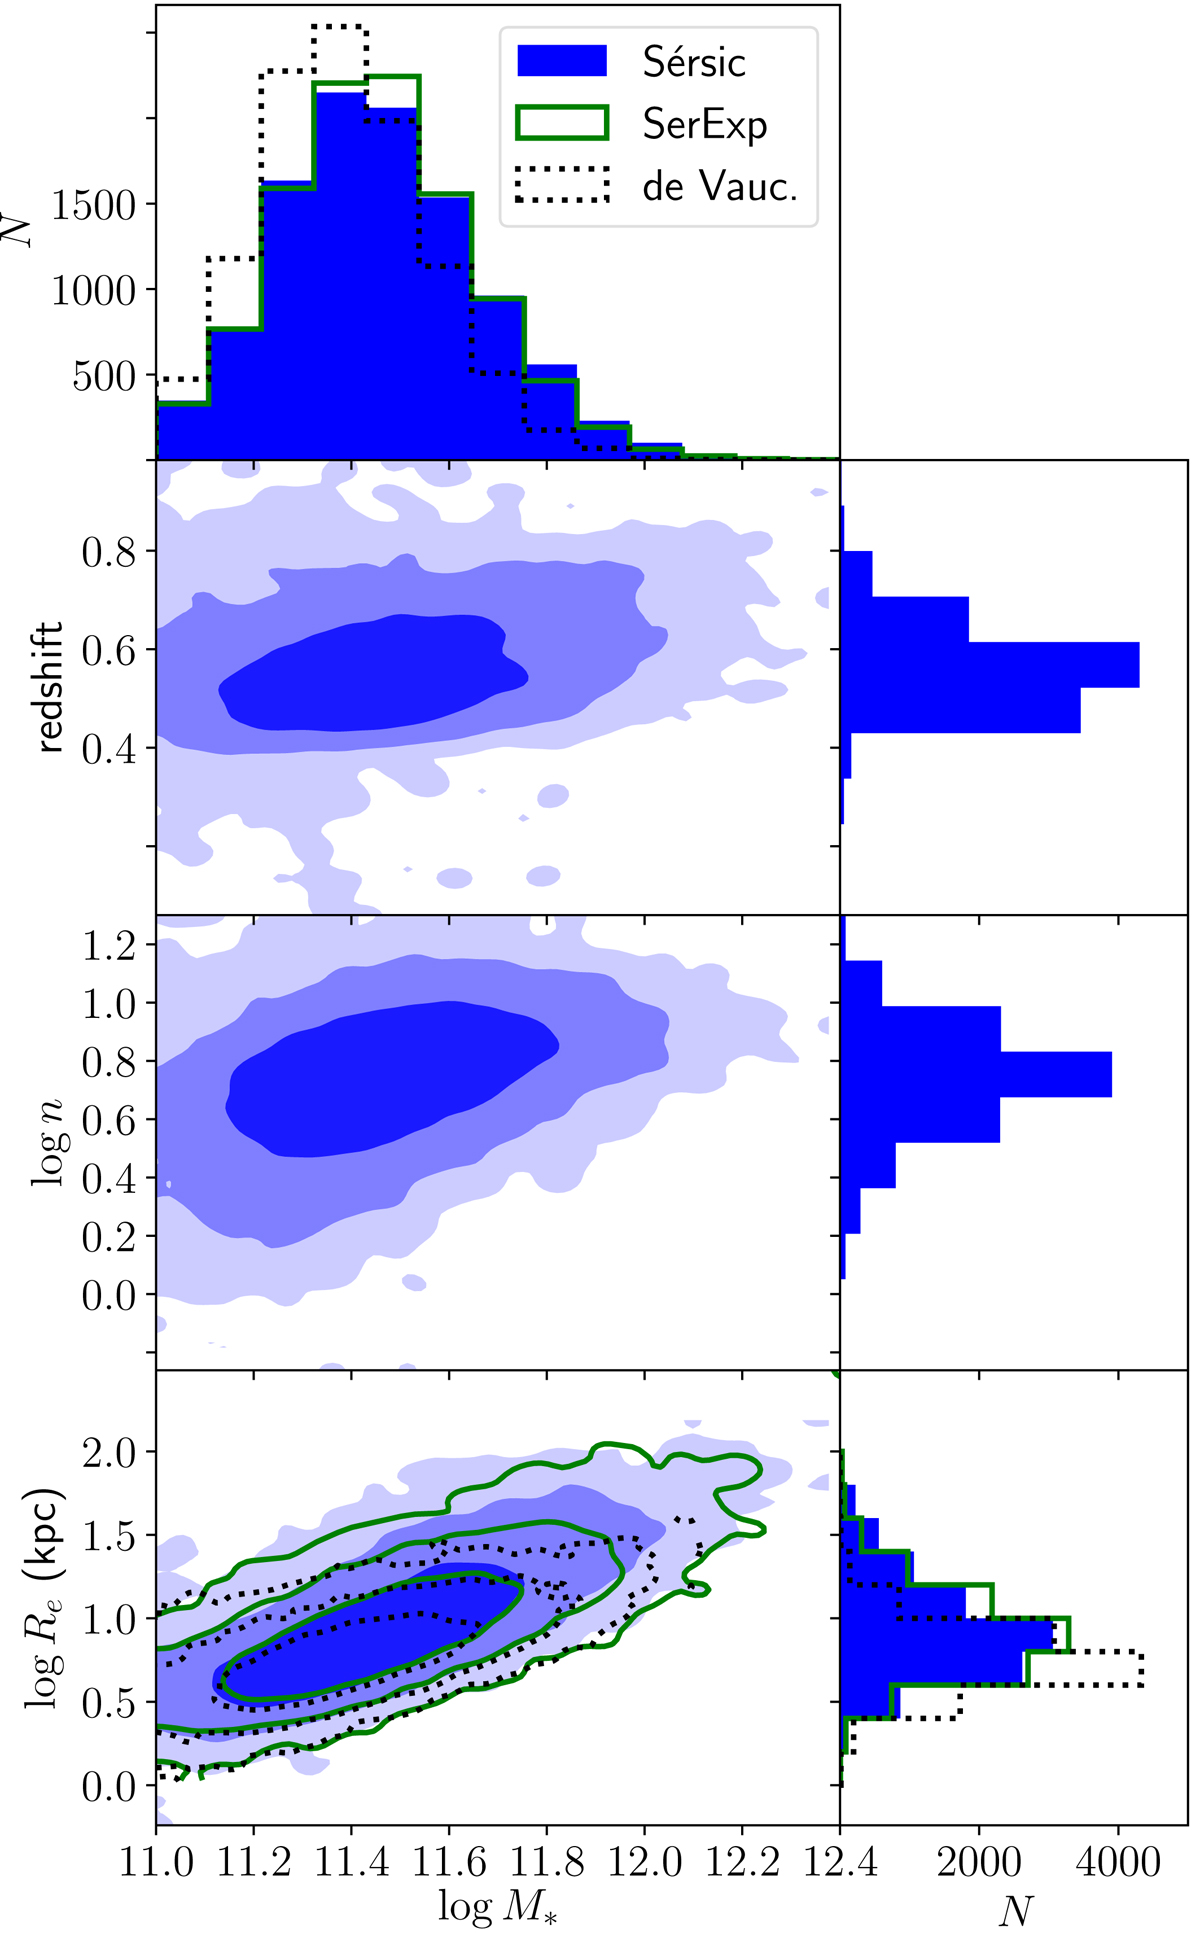
Distribution in half-light radius, Sérsic index, and redshift as a function of stellar mass of the sample of 10 403 CMASS galaxies. Contour levels mark the 68%, 95%, and 99.7% enclosed probability regions. Blue contours and histograms refer to the fiducial model, consisting of a single Sérsic surface brightness profile for each galaxy. The distribution in stellar mass and size obtained with the SerExp model, described in Sect. 2.7, is plotted in green, while that obtained with the de Vaucouleurs model is marked by solid lines.
Current usage metrics show cumulative count of Article Views (full-text article views including HTML views, PDF and ePub downloads, according to the available data) and Abstracts Views on Vision4Press platform.
Data correspond to usage on the plateform after 2015. The current usage metrics is available 48-96 hours after online publication and is updated daily on week days.
Initial download of the metrics may take a while.