Fig. 15.
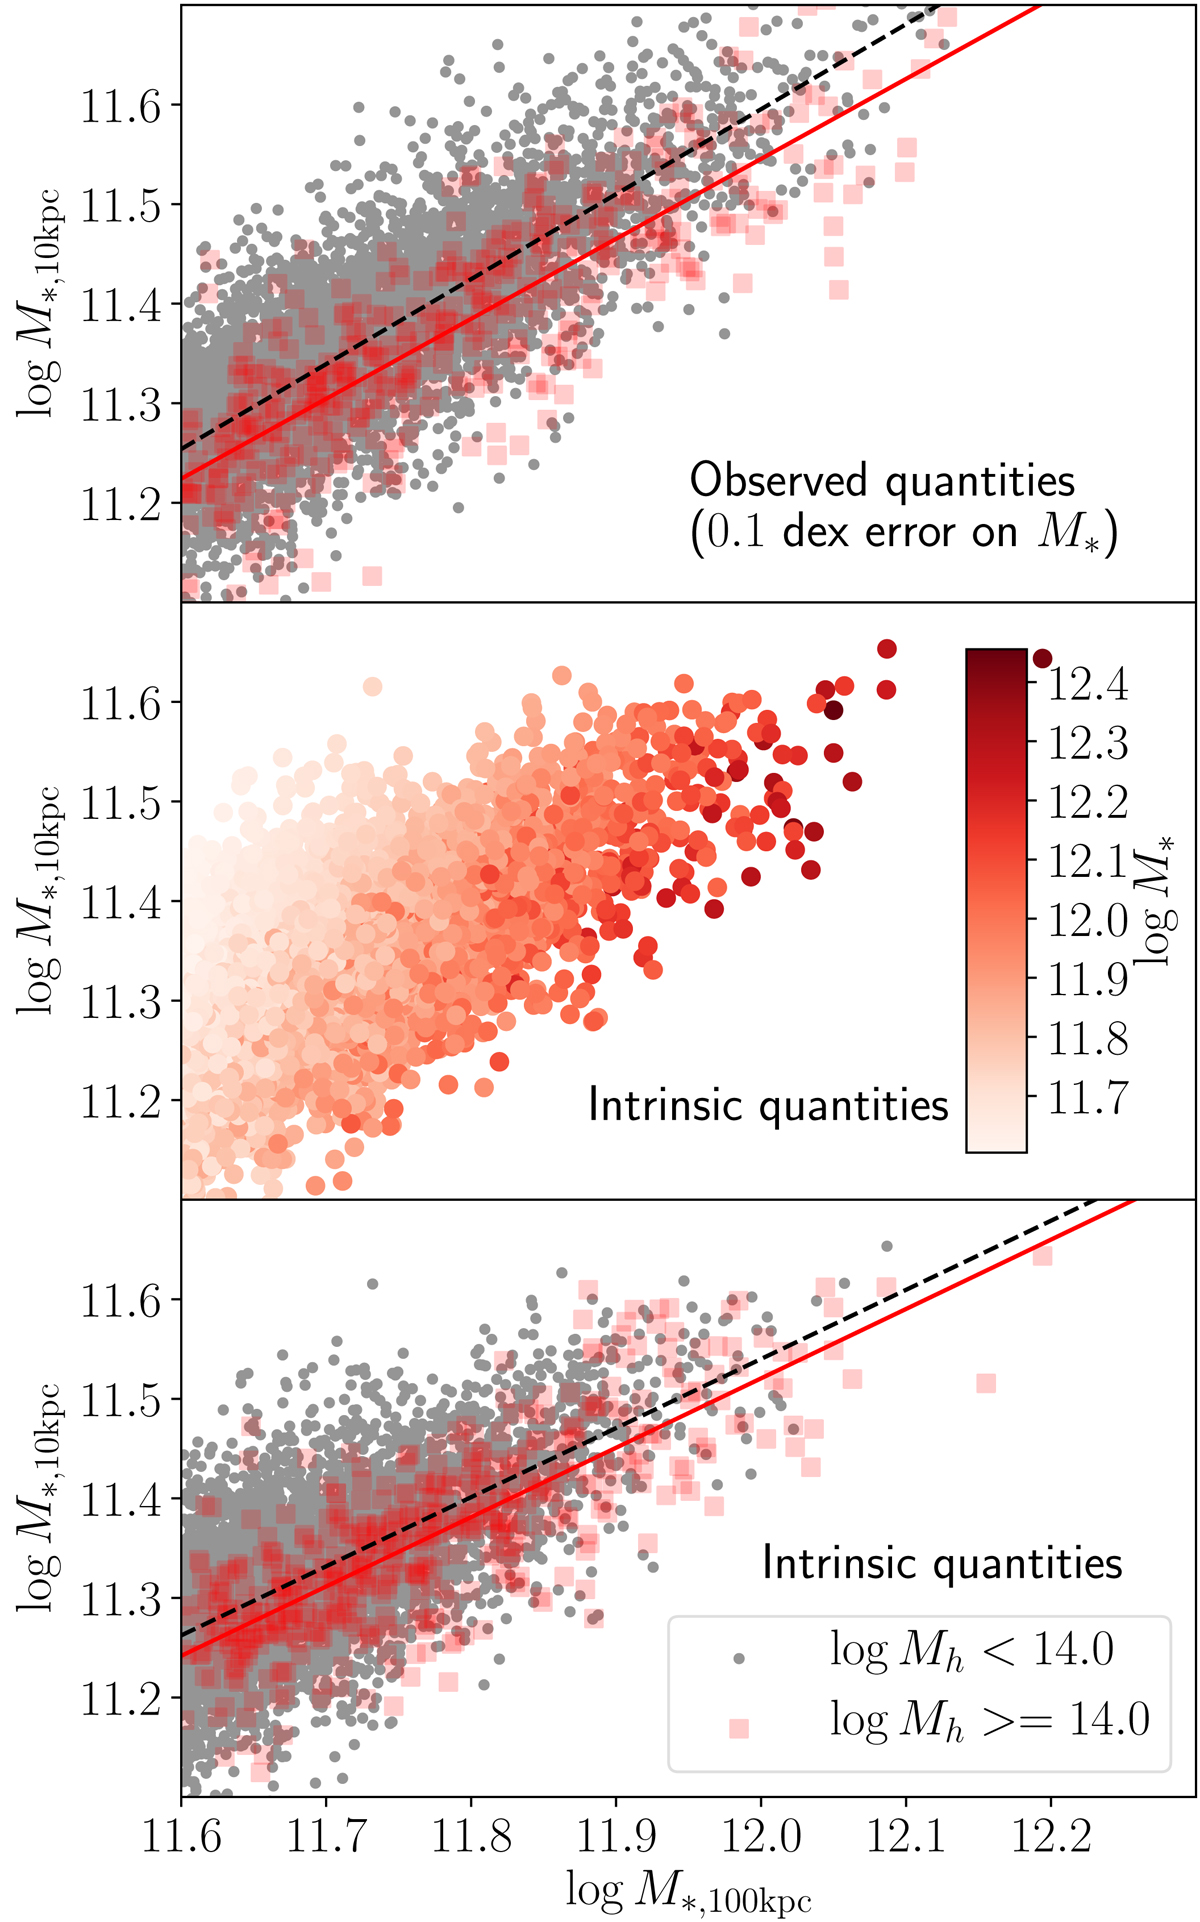
Posterior predictive plot, showing the stellar mass enclosed within 10 kpc as a function of the stellar mass enclosed within 100 kpc of a mock sample of galaxies, generated from the maximum-likelihood values of the hyper-parameters of our single Sérsic profile-based model. Bottom panel: sample split between galaxies that live in halos more massive than 1014 M⊙ (red squares) and those that live in less massive halos (grey dots). The red and black lines are the best-fit linear relations between M*, 10 kpc and M*, 100 kpc for the more massive halos and less massive halos, respectively. Middle panel: data points from the bottom panel are colour-coded according to the total stellar mass. Top panel: same as the bottom panel, but with a 0.1 dex random error on the stellar mass measurements.
Current usage metrics show cumulative count of Article Views (full-text article views including HTML views, PDF and ePub downloads, according to the available data) and Abstracts Views on Vision4Press platform.
Data correspond to usage on the plateform after 2015. The current usage metrics is available 48-96 hours after online publication and is updated daily on week days.
Initial download of the metrics may take a while.