Fig. 14.
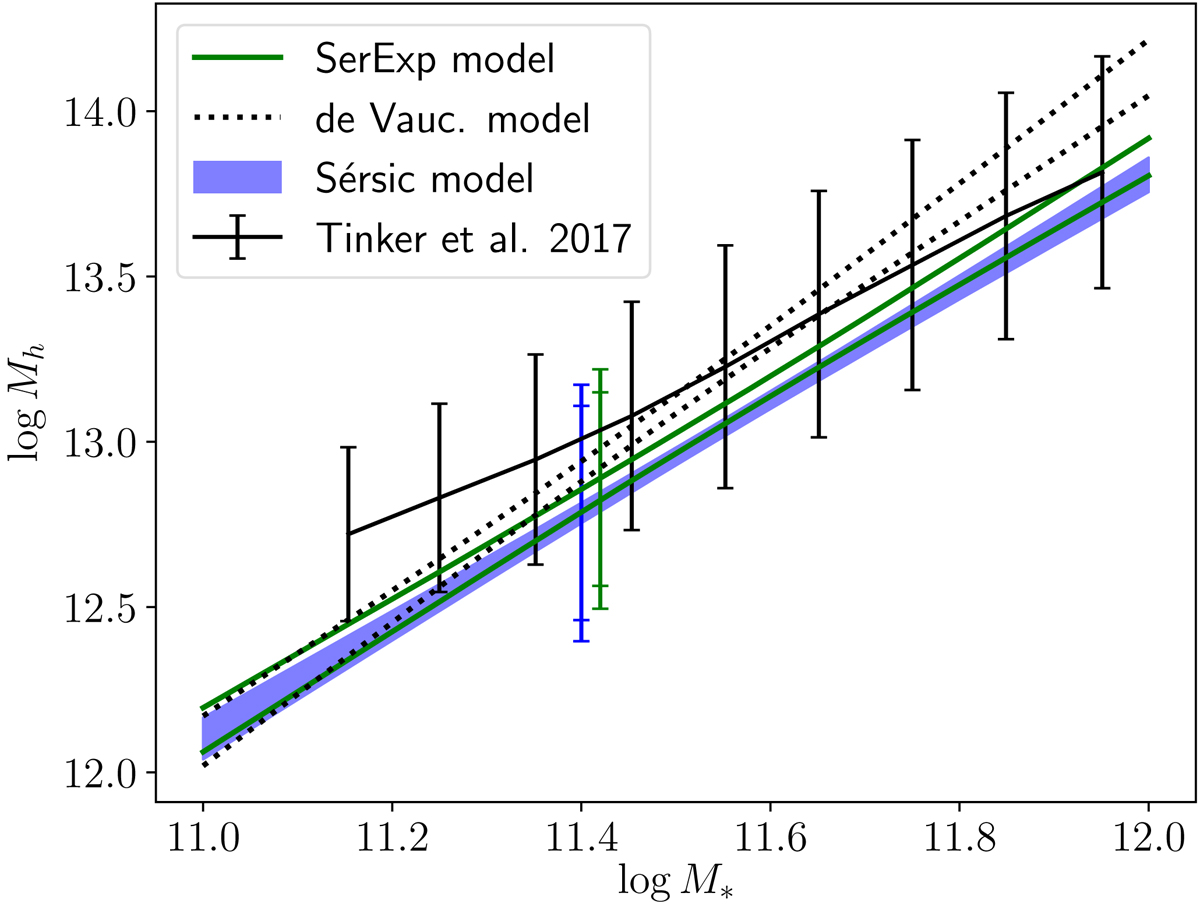
Average value of log Mh as a function of M*. The blue band and the green and dotted black pairs of lines show the 1σ confidence limit obtained from our analysis based on the Sérsic, SerExp, and de Vaucouleurs model, respectively. The solid black line is a measurement from Tinker et al. (2017), obtained from galaxy clustering and abundance matching. Error bars indicate the intrinsic scatter in log Mh. The inner (outer) ticks on the error bars relative to our measurements refer to the 84 (16) percentile of our inference on the scatter parameter σh. The inference on the intrinsic scatter obtained with the de Vaucouleurs model is omitted to avoid confusion.
Current usage metrics show cumulative count of Article Views (full-text article views including HTML views, PDF and ePub downloads, according to the available data) and Abstracts Views on Vision4Press platform.
Data correspond to usage on the plateform after 2015. The current usage metrics is available 48-96 hours after online publication and is updated daily on week days.
Initial download of the metrics may take a while.