Fig. 13.
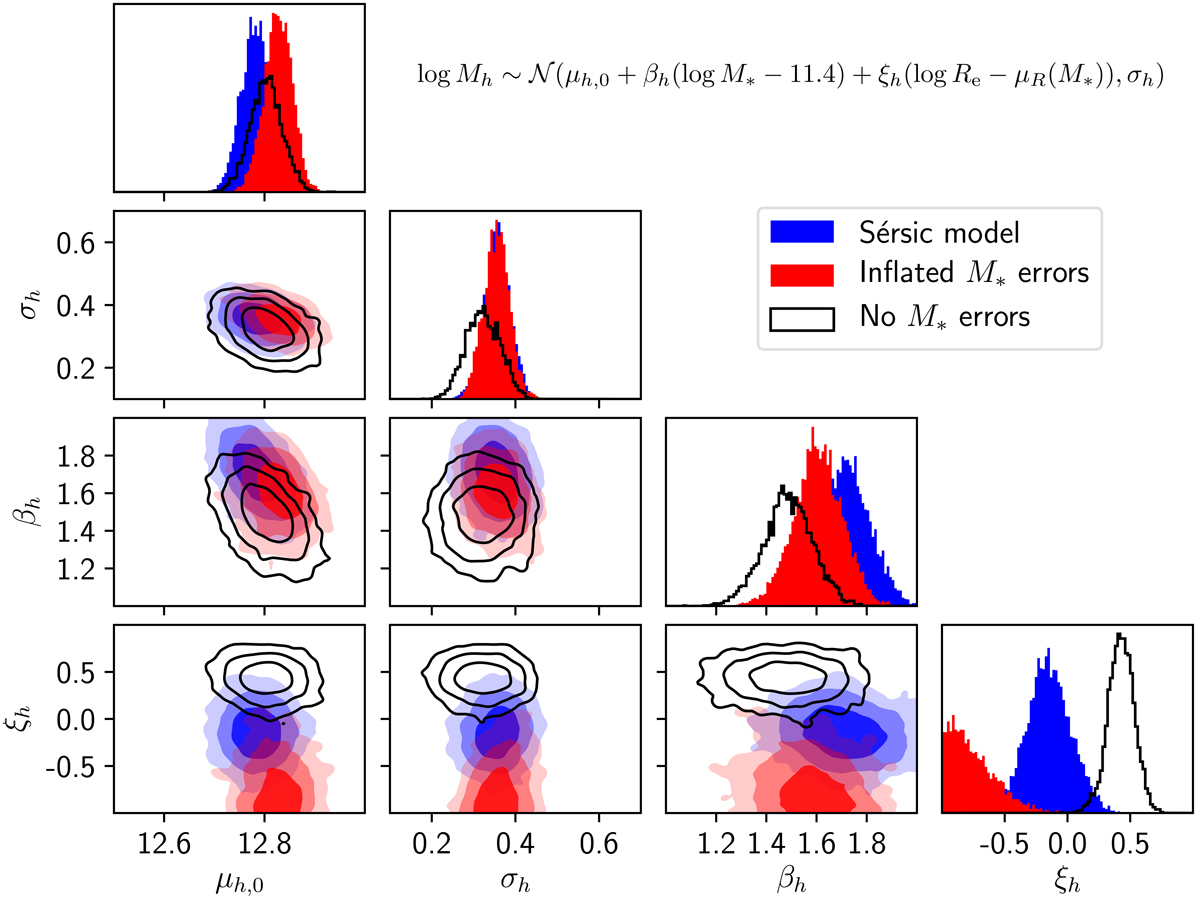
Posterior probability distribution of the parameters describing the distribution of halo mass based on the model of Sect. 4.1. The blue contours show the inference obtained using the Sérsic model, as obtained in Sect. 4 and plotted in Fig. 10. The distribution shown in red has been obtained by repeating the analysis of the Sérsic model and adding 0.1 dex in quadrature to the uncertainties on the observed stellar masses. The solid lines mark the distribution obtained by setting all uncertainties on the stellar masses to zero.
Current usage metrics show cumulative count of Article Views (full-text article views including HTML views, PDF and ePub downloads, according to the available data) and Abstracts Views on Vision4Press platform.
Data correspond to usage on the plateform after 2015. The current usage metrics is available 48-96 hours after online publication and is updated daily on week days.
Initial download of the metrics may take a while.