Fig. 11.
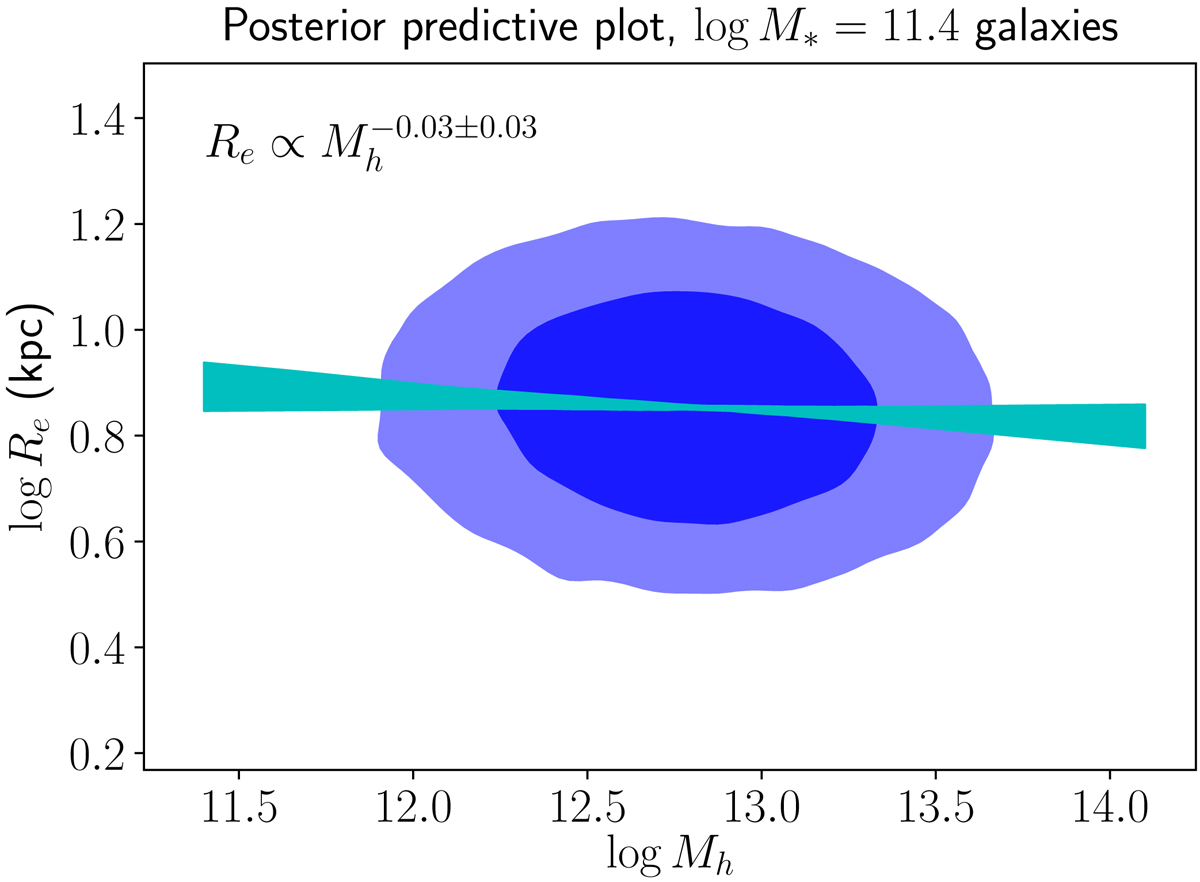
Posterior predictive distribution in half-light radius as a function of halo mass for galaxies with log M* = 11.4. This is obtained by first drawing values of the hyper-parameters from the posterior probability distribution of our Sérsic model-based inference, then drawing values of Re and Mh for 1000 galaxies, given the model specified by the hyper-parameters. Blue contours correspond to 68% and 95% enclosed probability. The cyan band shows the 68% credible region of the size-halo mass relation, obtained by fitting a power-law relation to the mock distribution of Re and Mh at each draw of the hyper-parameters.
Current usage metrics show cumulative count of Article Views (full-text article views including HTML views, PDF and ePub downloads, according to the available data) and Abstracts Views on Vision4Press platform.
Data correspond to usage on the plateform after 2015. The current usage metrics is available 48-96 hours after online publication and is updated daily on week days.
Initial download of the metrics may take a while.