Fig. 9.
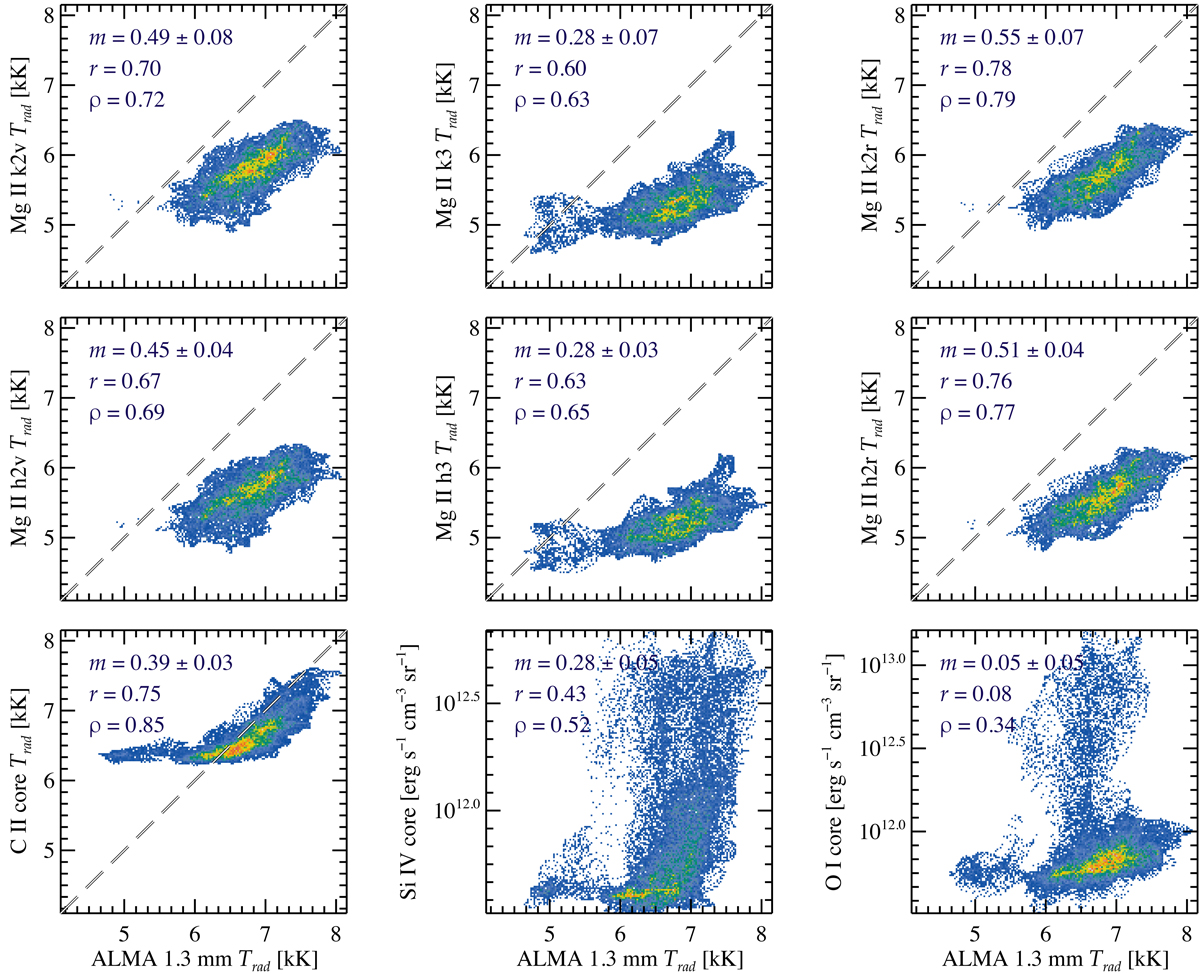
Scatter plots of radiation temperatures derived from various near and far ultraviolet line-features from IRIS versus those obviated with ALMA at 1.3 mm. The plots represent the pixel-to-pixel relationships for the pixel where their samling time difference are equal to or smaller than two minutes, corresponding to the blue hatched area in Fig. 4f. The colours represent density of the scatter points (with the highest density number being coloured red and the lowest density dark blue). At each plot, the regression slope of the linear fit (m), the Pearson correlation coefficient (r), and the Spearman’s rank correlation coefficient (ρ) are also indicated.
Current usage metrics show cumulative count of Article Views (full-text article views including HTML views, PDF and ePub downloads, according to the available data) and Abstracts Views on Vision4Press platform.
Data correspond to usage on the plateform after 2015. The current usage metrics is available 48-96 hours after online publication and is updated daily on week days.
Initial download of the metrics may take a while.