Fig. 8.
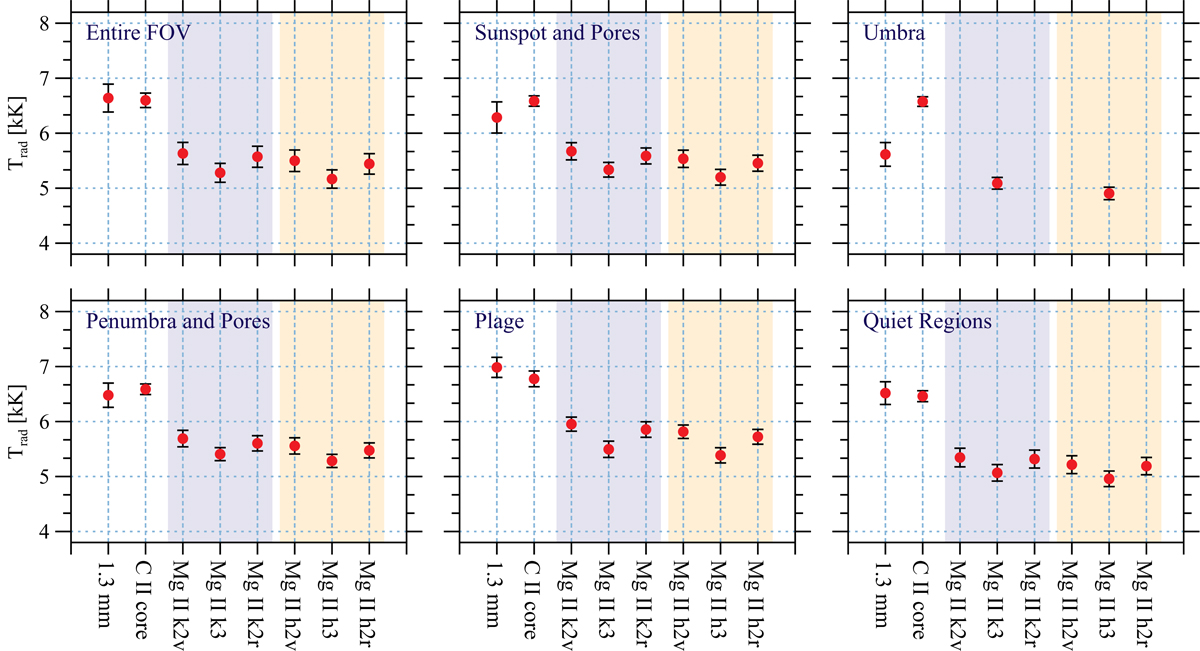
Comparison of the mean radiation temperature (red dots) retrieved from the millimetre and ultraviolet observations with ALMA and IRIS. The error bars indicate the standard deviations of the temperature distributions. For better visibility, the purple and yellow stripes have been depicted to mark the line features of the IRIS Mg II k and Mg II h, respectively.
Current usage metrics show cumulative count of Article Views (full-text article views including HTML views, PDF and ePub downloads, according to the available data) and Abstracts Views on Vision4Press platform.
Data correspond to usage on the plateform after 2015. The current usage metrics is available 48-96 hours after online publication and is updated daily on week days.
Initial download of the metrics may take a while.