Fig. 6.
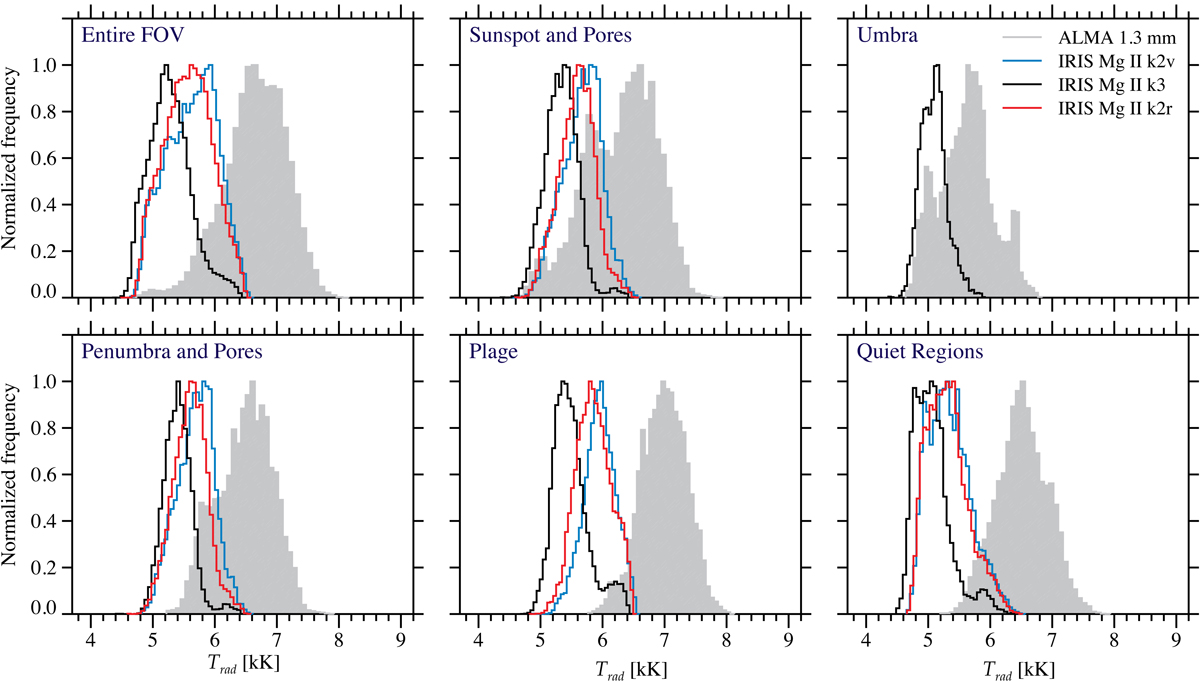
Distributions of radiation temperature of ALMA 1.3 mm (filled grey) and of various features of the IRIS Mg II k line at 279.6 nm (see the legend to the figure in the upper right panel). The histograms are plotted for the entire field-of-view and for the various isolated regions with different levels of magnetic fields (see main text).
Current usage metrics show cumulative count of Article Views (full-text article views including HTML views, PDF and ePub downloads, according to the available data) and Abstracts Views on Vision4Press platform.
Data correspond to usage on the plateform after 2015. The current usage metrics is available 48-96 hours after online publication and is updated daily on week days.
Initial download of the metrics may take a while.