Fig. 4.
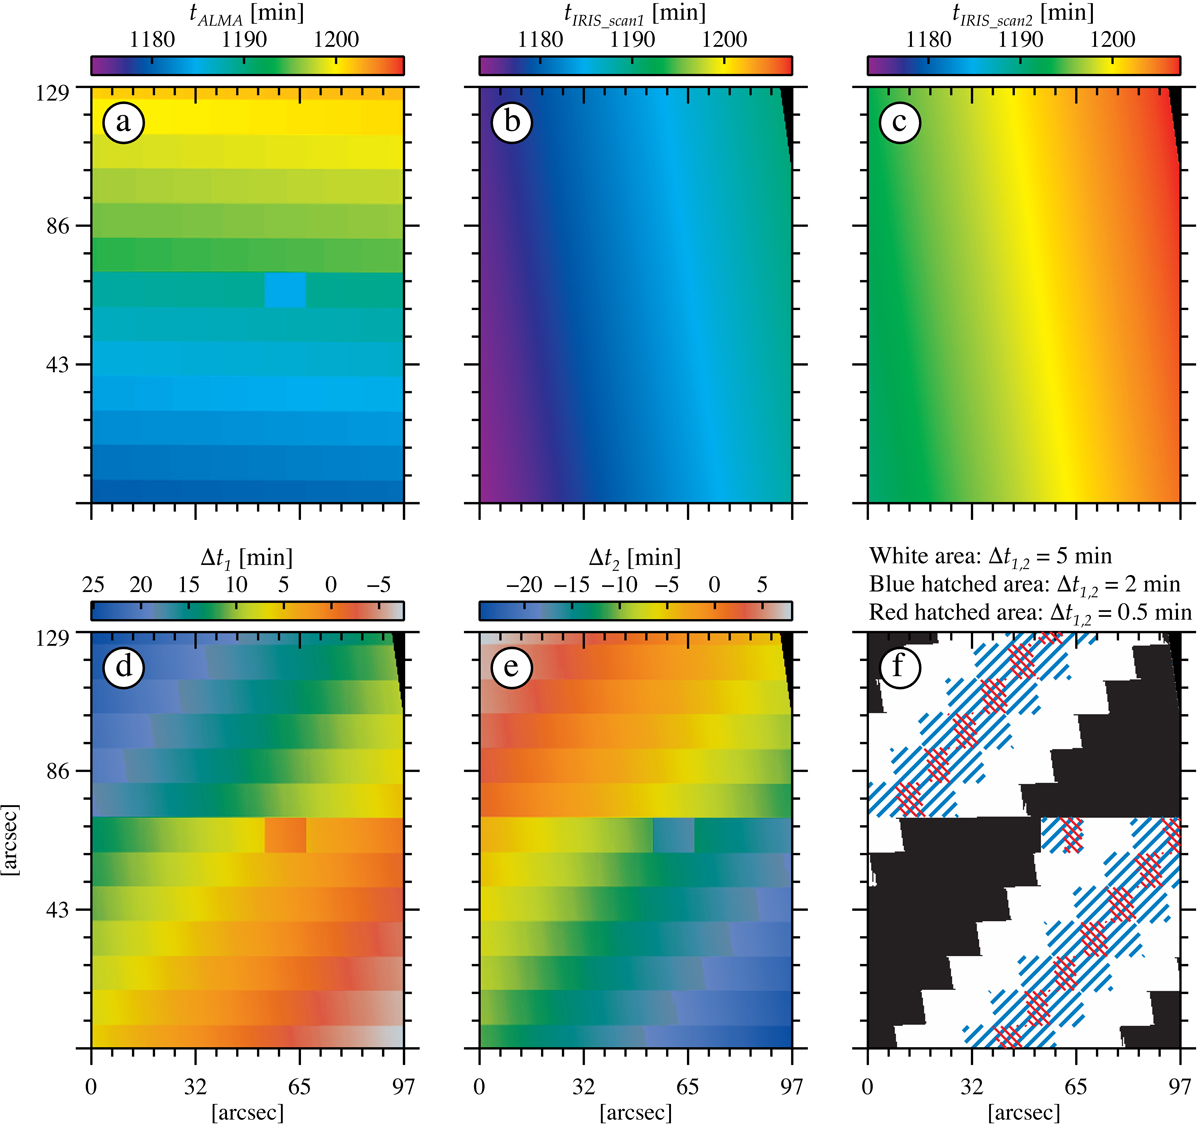
Sampling patterns of the ALMA image (panel a), the first (panel b) and the second (panel c) scans of IRIS, after spatial co-alignment. The colours in panels a–c indicate the observing times from the UT midnight. The observing-time difference maps between ALMA and the first and second IRIS scans (Δt1 and Δt2) are shown in panelsd and e, respectively. The positive values mean that the ALMA’s sampling leads that of the IRIS. The colour in panelsd and e represents the time-differences. Panel f: a mask where three regions with a maximum time-difference (indicated on top of the panel) are depicted. The mask is the result of combination of the first two IRIS scans (to cover the largest areas with small time-differences with ALMA observations).
Current usage metrics show cumulative count of Article Views (full-text article views including HTML views, PDF and ePub downloads, according to the available data) and Abstracts Views on Vision4Press platform.
Data correspond to usage on the plateform after 2015. The current usage metrics is available 48-96 hours after online publication and is updated daily on week days.
Initial download of the metrics may take a while.