Fig. 3.
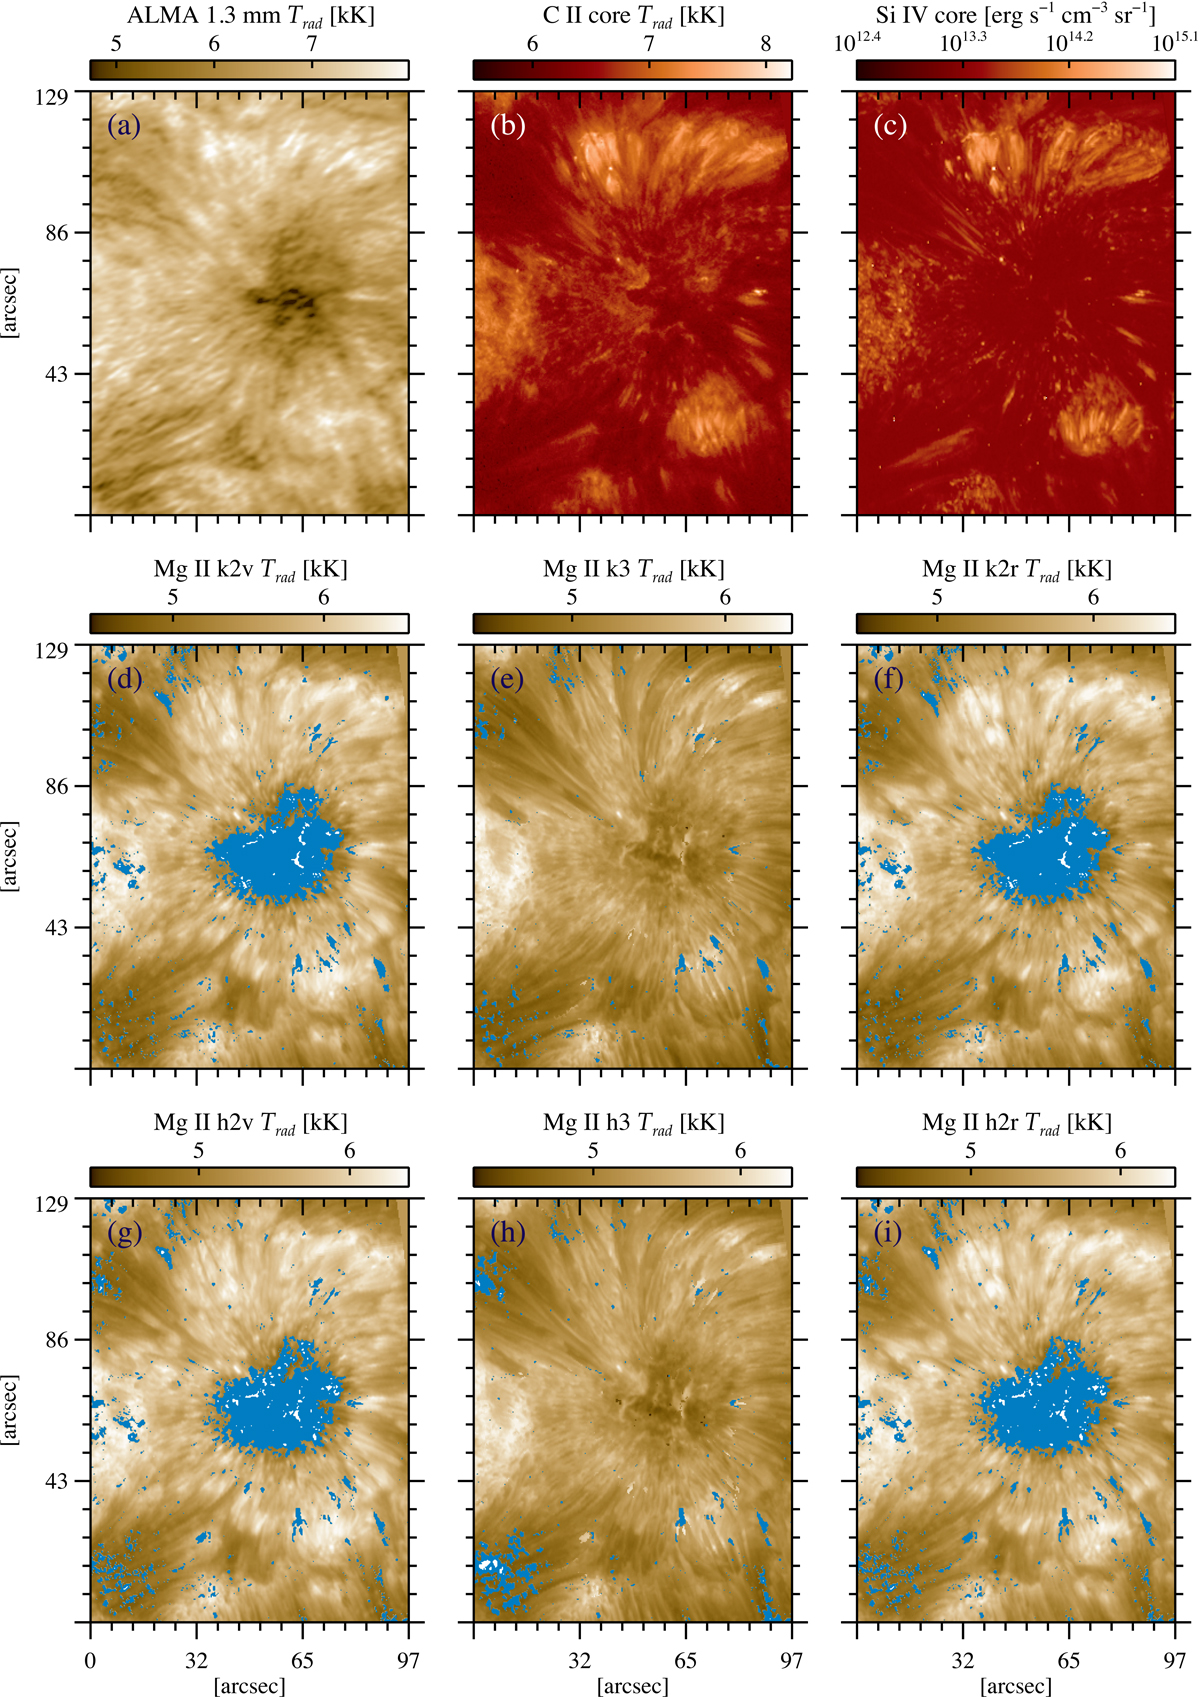
Radiation temperature maps of the ALMA 1.3 mm (panel a) and of a few IRIS line features at UV wavelengths: line core of C II 133.4 nm (panel c); blue emission peak, line core, and red emission peak of Mg II k 279.6 nm (panels d–f) and of Mg II h 280.4 nm (panels g–i). For comparison, line-core intensity of the IRIS Si IV 139.4 nm is illustrated in panel c. Blue pixels are regions where the corresponding line features could not be determined.
Current usage metrics show cumulative count of Article Views (full-text article views including HTML views, PDF and ePub downloads, according to the available data) and Abstracts Views on Vision4Press platform.
Data correspond to usage on the plateform after 2015. The current usage metrics is available 48-96 hours after online publication and is updated daily on week days.
Initial download of the metrics may take a while.