Fig. 15.
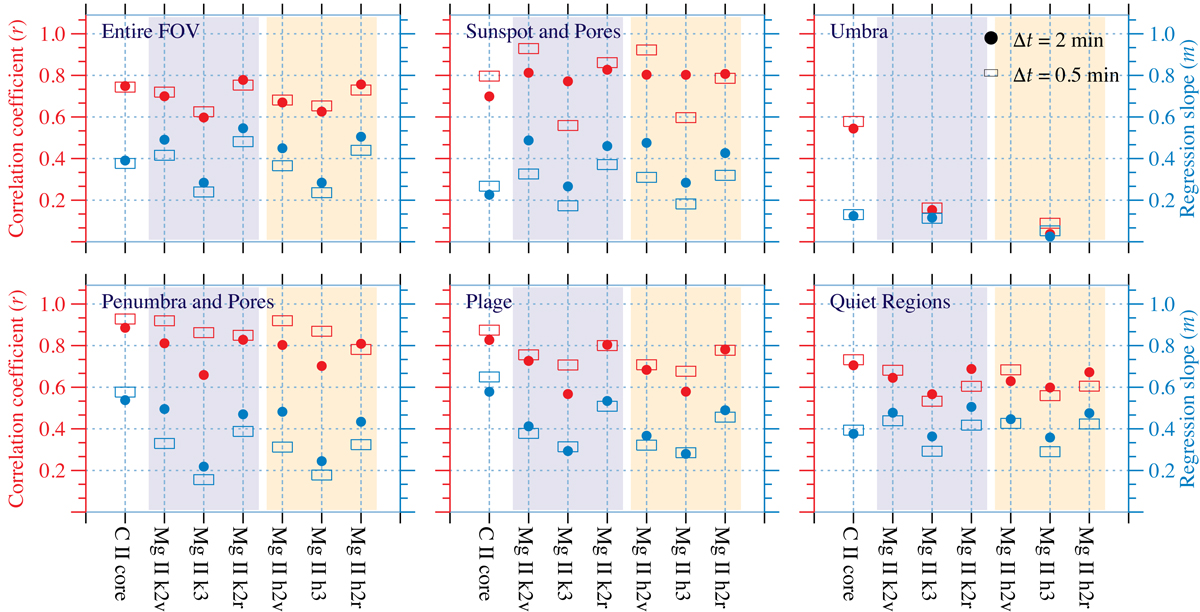
Comparison of Pearson correlation coefficients r (red; left y-axis) as well as regression slopes of linear fits m (blue; right y-axis) in different solar regions between radiation temperatures of various UV pixels and their corresponding ALMA 1.3 mm. The filled circles and open rectangles indicate the parameters for two sets of pixels with maximum observing time differences of 2 and 0.5 min, respectively.
Current usage metrics show cumulative count of Article Views (full-text article views including HTML views, PDF and ePub downloads, according to the available data) and Abstracts Views on Vision4Press platform.
Data correspond to usage on the plateform after 2015. The current usage metrics is available 48-96 hours after online publication and is updated daily on week days.
Initial download of the metrics may take a while.