Fig. 1.
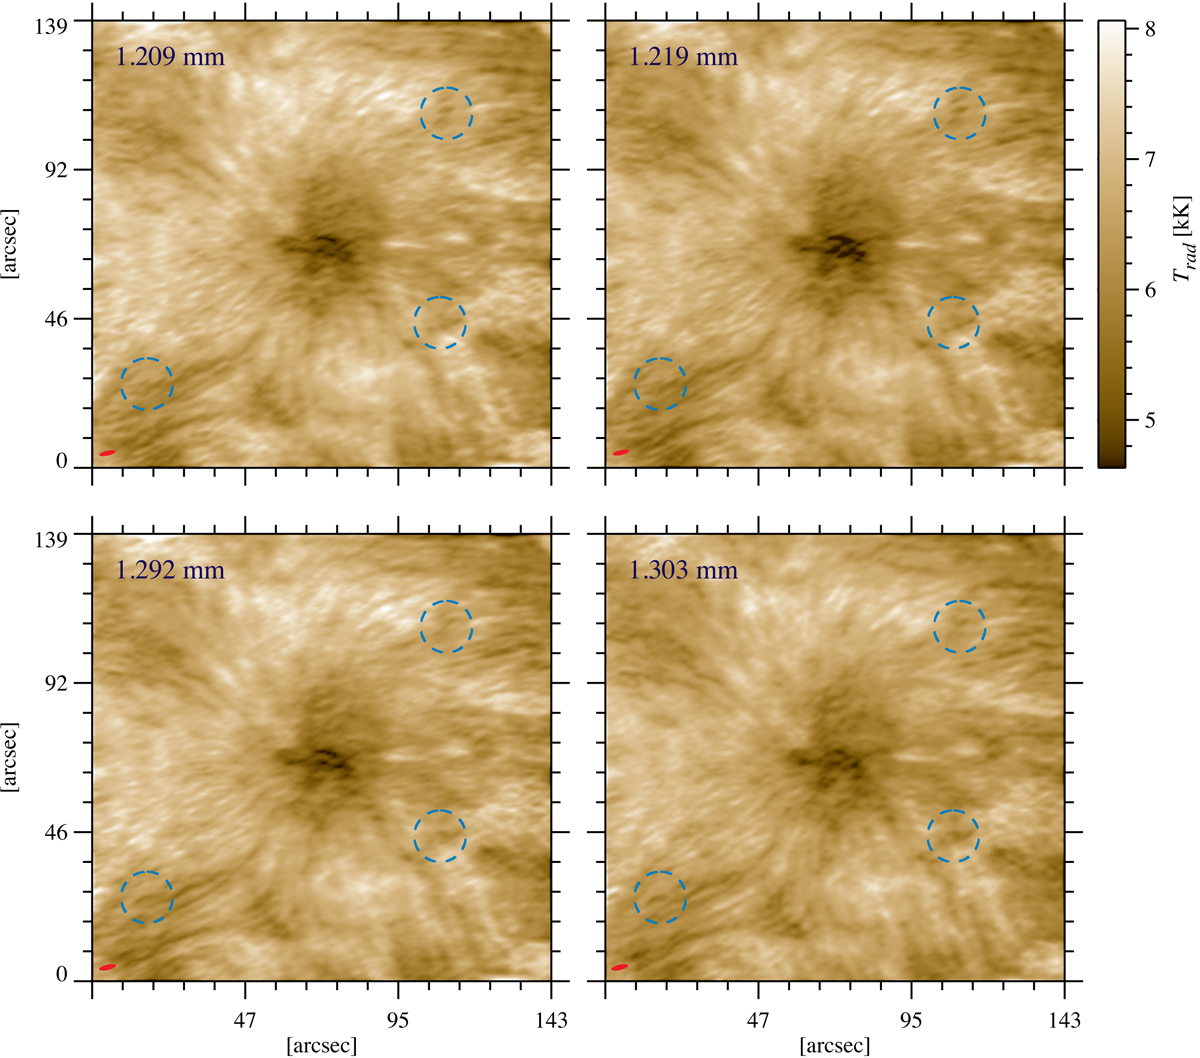
ALMA sub-band images of brightness temperature in band 6. The sampling wavelengths are indicated in the upper-left corner of each panel. The circles mark examples of structures with different temperature distributions in the sub-band images, sampling various (but close) heights in the solar chromosphere. The red ellipses in the lower-left corners illustrate the beam size (i.e. size of the resolution element) of each sub band.
Current usage metrics show cumulative count of Article Views (full-text article views including HTML views, PDF and ePub downloads, according to the available data) and Abstracts Views on Vision4Press platform.
Data correspond to usage on the plateform after 2015. The current usage metrics is available 48-96 hours after online publication and is updated daily on week days.
Initial download of the metrics may take a while.