Fig. 4.
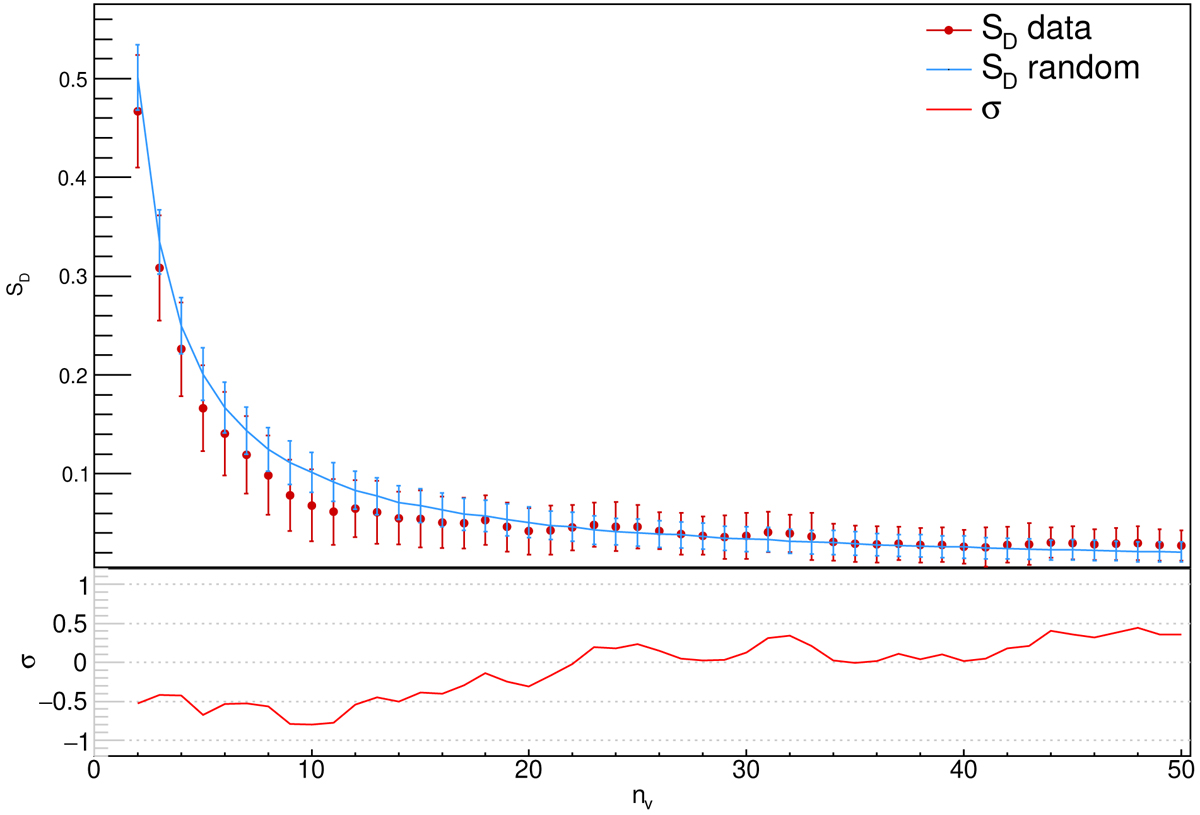
Statistics SD of all sources and its significance with respect to random isotropic polarization distribution. The error bars on our data sample SD are jackknife errors. The random sample SD is also shown with RMS error bars drawn from 1000 random samples. The σ significance is the difference between the data SD and the random SD samples as defined in Eq. (4).
Current usage metrics show cumulative count of Article Views (full-text article views including HTML views, PDF and ePub downloads, according to the available data) and Abstracts Views on Vision4Press platform.
Data correspond to usage on the plateform after 2015. The current usage metrics is available 48-96 hours after online publication and is updated daily on week days.
Initial download of the metrics may take a while.