Fig. 8.
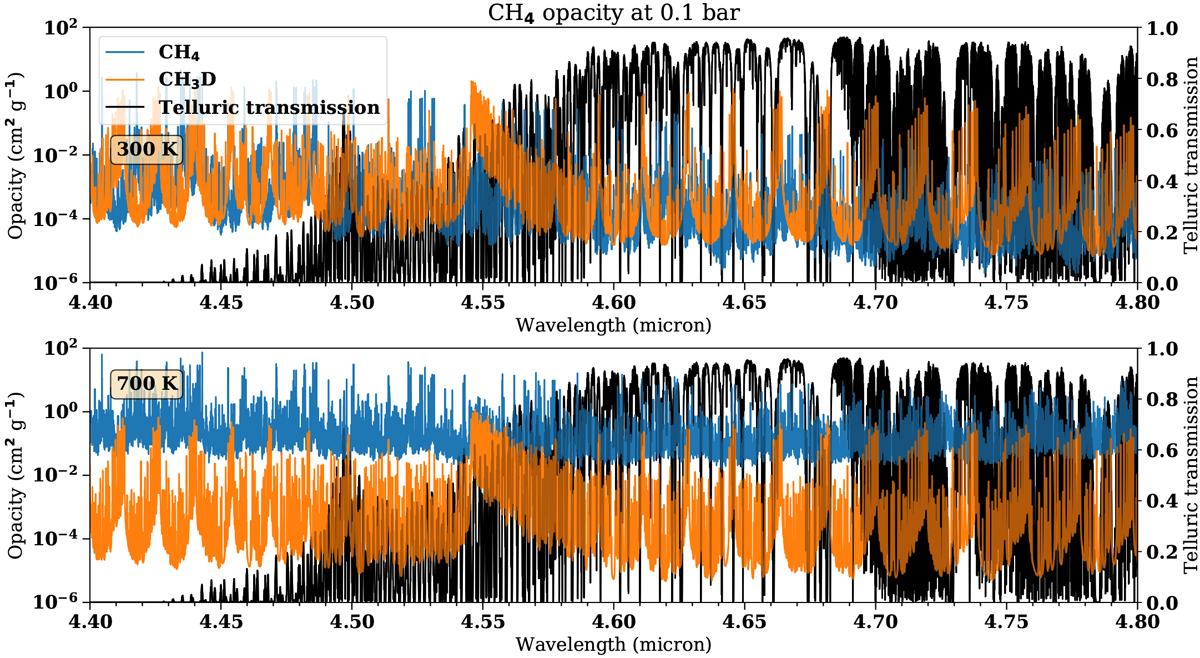
Opacities of CH4 (blue) and CH3D (orange), shown at T = 300 K (upper panel) and T = 700 K (lower panel), at P = 0.1 bar, which is a representative pressure value probed by methane and CH3D in the calculations considered here. The opacities have been scaled such that CH4 and CH3D constitute 98.8% and 8 × 10⁻⁵ of all CH4 isotopologues, respectively. The telluric transmission is shown in black.
Current usage metrics show cumulative count of Article Views (full-text article views including HTML views, PDF and ePub downloads, according to the available data) and Abstracts Views on Vision4Press platform.
Data correspond to usage on the plateform after 2015. The current usage metrics is available 48-96 hours after online publication and is updated daily on week days.
Initial download of the metrics may take a while.