Fig. 4.
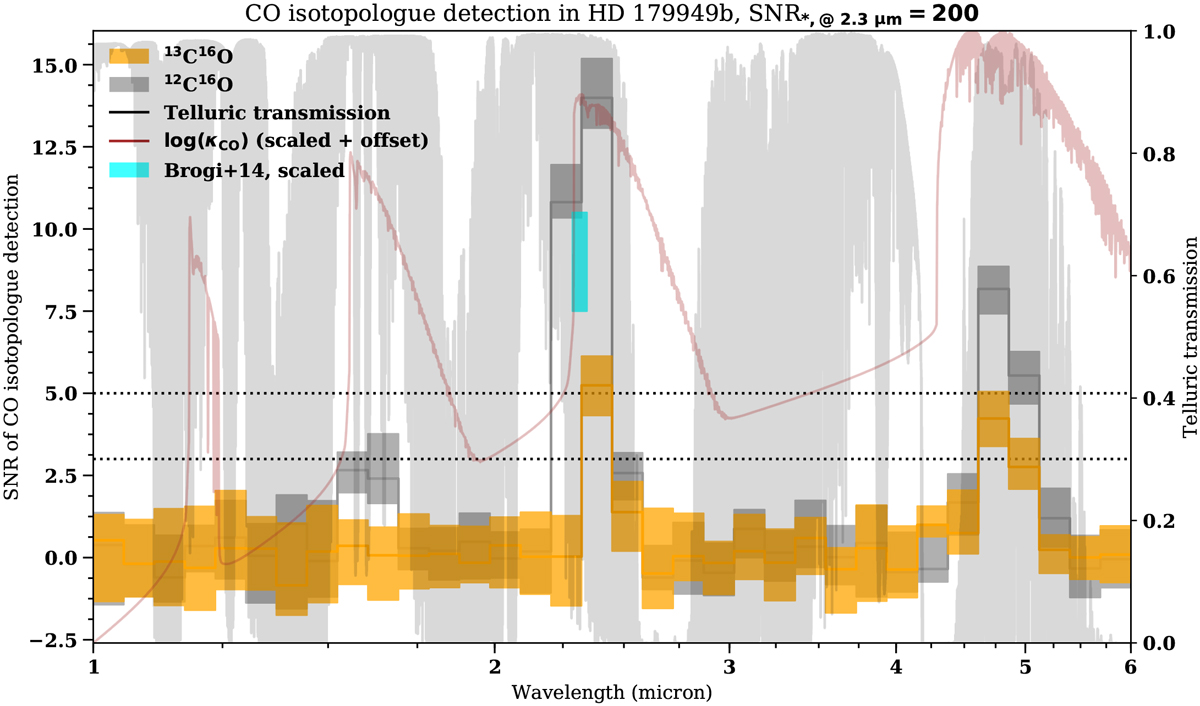
Wavelength-dependent detection S/N for the secondary 13C16O (orange boxes) and the main 12C16O isotopologue (gray boxes). The box widths correspond to the wavelength range of the synthetic observations, while the height corresponds to the 16 and 84 percentiles of themeasured S/Ns, as derived by running the simulations multiple times. For 13C16O the S/N of data set B cross-correlated with the pure isotopologue template spectrum are shown, which is conservative, corresponding to the solid blue line in Fig. 3. For 12C16O the S/N of data set A cross-correlated with the pure isotopologue template spectrum are shown. We assumed 100 observationswith S/N*(2.3 μm) = 200, used to calculate the stellar S/N as function of wavelength. In the background, we show the telluric transmission model (gray solid line), as well as the scaled and offset logarithm of the CO opacity at T = 1200 K and P = 10−4 bar (light red solid line). The CO detection by Brogi et al. (2014) is shown in cyan. The actual S/N value of the CO detection in Brogi et al. (2014) is 5.8, but due to the larger wavelength coverage of our bins one has to scale this value up to a S/N of 9. This is somewhat lower than our prediction for 12C16O, but the S/Nof their observations is also smaller.
Current usage metrics show cumulative count of Article Views (full-text article views including HTML views, PDF and ePub downloads, according to the available data) and Abstracts Views on Vision4Press platform.
Data correspond to usage on the plateform after 2015. The current usage metrics is available 48-96 hours after online publication and is updated daily on week days.
Initial download of the metrics may take a while.