Fig. B.1.
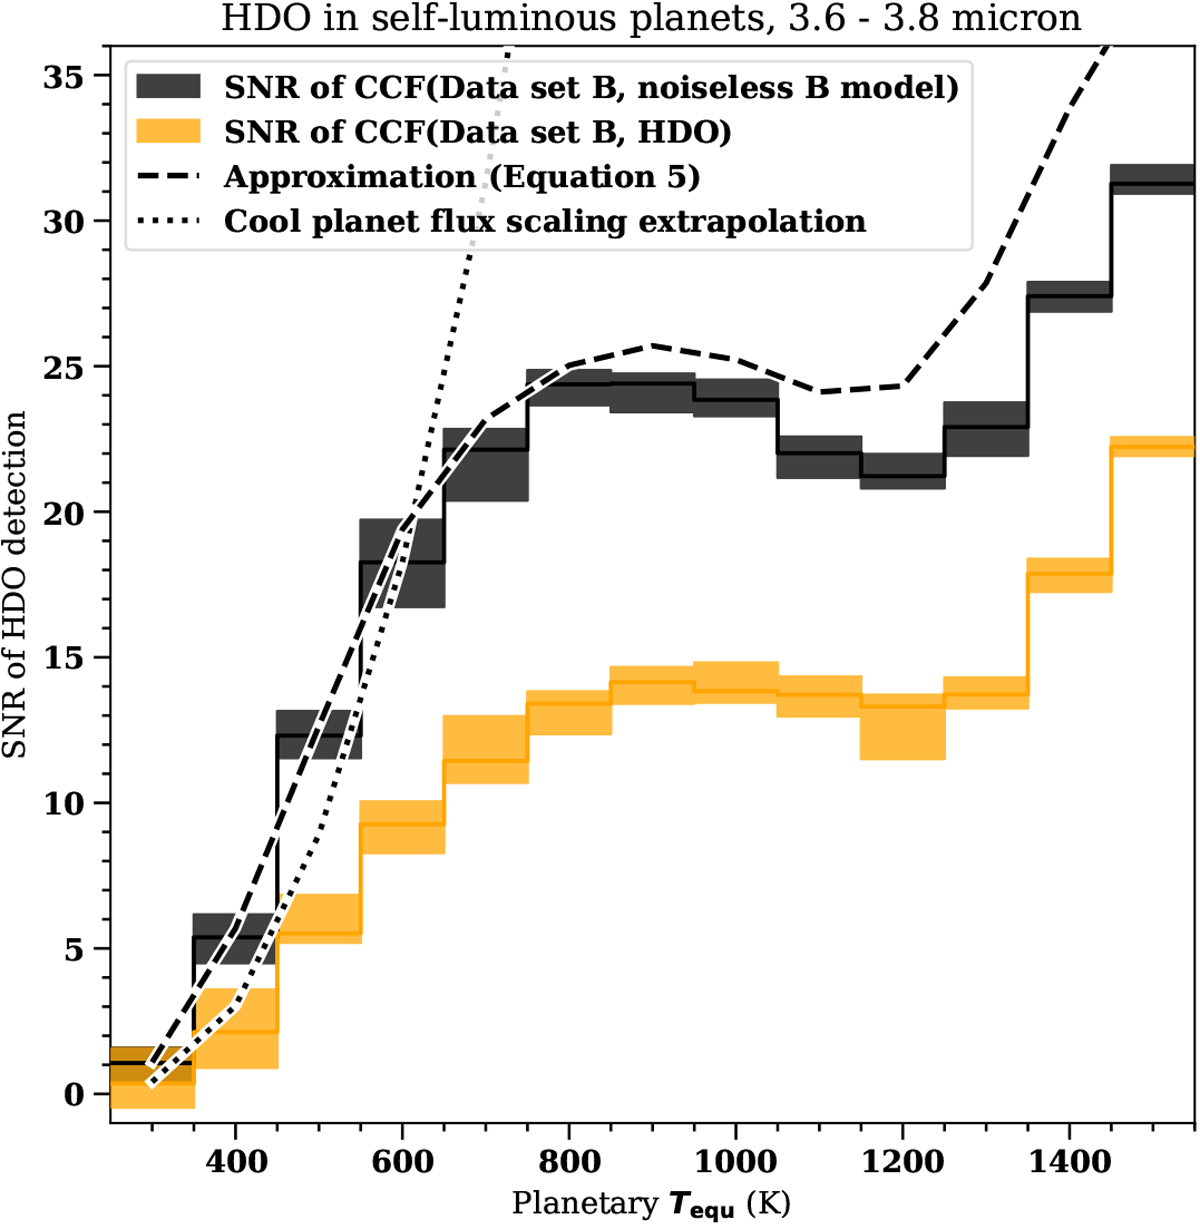
S/N of the HDO detection in the spectrum of a directly imaged gas planet as a function of the planetary Tequ. The HDO/H2O ratio was 4 × 10⁻⁵. Here we assumed S/N*, at 3.7μm = 3317 per spectrum, a stellar flux 1000 times smaller at the position of the planet, considering 100 spectral observations. Orange boxes: detection S/N when correlating the contaminant removed observation (data set B) with a pure HDO isotopologue template. Black boxes: detection S/N when correlating with the noiseless, telluric-free model B spectrum. The box height corresponds to the measured 16 and 84 percentiles of the measured S/Ns, when running the simulation multiple times. The black dotted line denotes the S/N scaling expected purely from the increasing planet–star contrast as the planet becomes hotter. This assumes that the ratio of the HDO and H2O opacities isnot temperature dependent. The black dashed line shows the prediction of the S/N signal following Eq. (5), indicating good agreement.
Current usage metrics show cumulative count of Article Views (full-text article views including HTML views, PDF and ePub downloads, according to the available data) and Abstracts Views on Vision4Press platform.
Data correspond to usage on the plateform after 2015. The current usage metrics is available 48-96 hours after online publication and is updated daily on week days.
Initial download of the metrics may take a while.