Fig. 10.
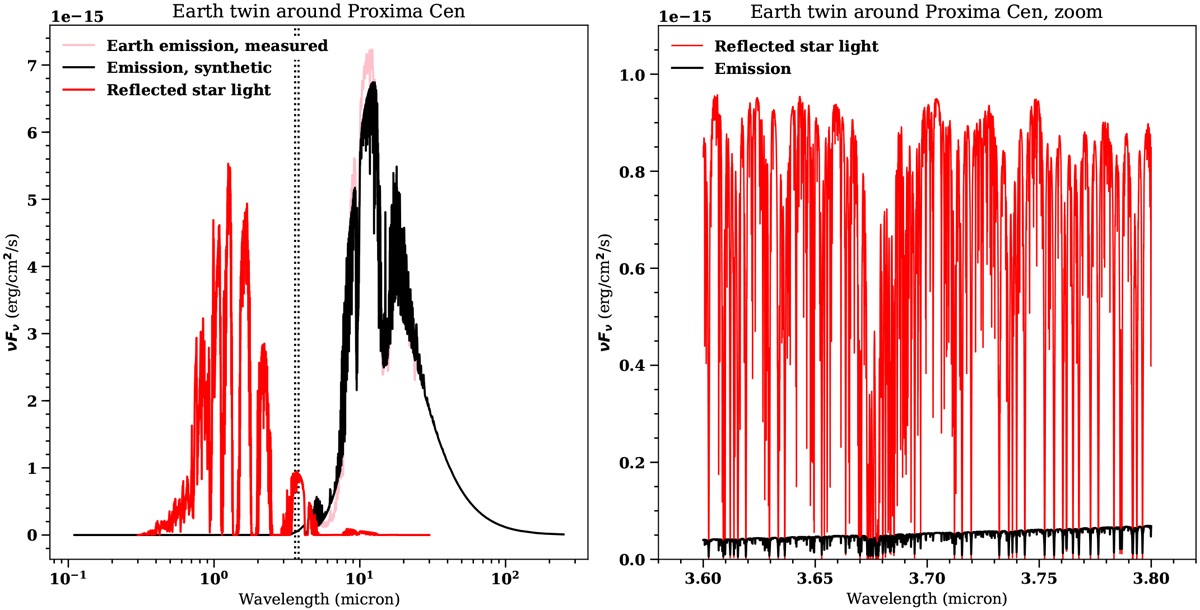
Apparent spectrum of Proxima Cen b at a distance of 1.29 pc, assuming it is identical to Earth. Left panel: planet synthetic thermal spectrum, assuming the Earth’s P–T profile and abundances is shown as a black solid line. As a comparison, measurements by the Nimbus 4 satellite are shown as a pink solid line, which largely overlap. The red solid line shows the reflected light assuming a surface albedo of 30%, including the attenuation of the planetary atmosphere. The two vertical black dashed lines denote the wavelength region of interest for probing HDO (3.6–3.8 μm). Right panel: same but focused on the 3.6–3.8 μm region, and showing high-resolution spectra. At these wavelength, the reflected starlight is ~15 times stronger than the intrinsic thermal emission from the planet.
Current usage metrics show cumulative count of Article Views (full-text article views including HTML views, PDF and ePub downloads, according to the available data) and Abstracts Views on Vision4Press platform.
Data correspond to usage on the plateform after 2015. The current usage metrics is available 48-96 hours after online publication and is updated daily on week days.
Initial download of the metrics may take a while.