Fig. 1.
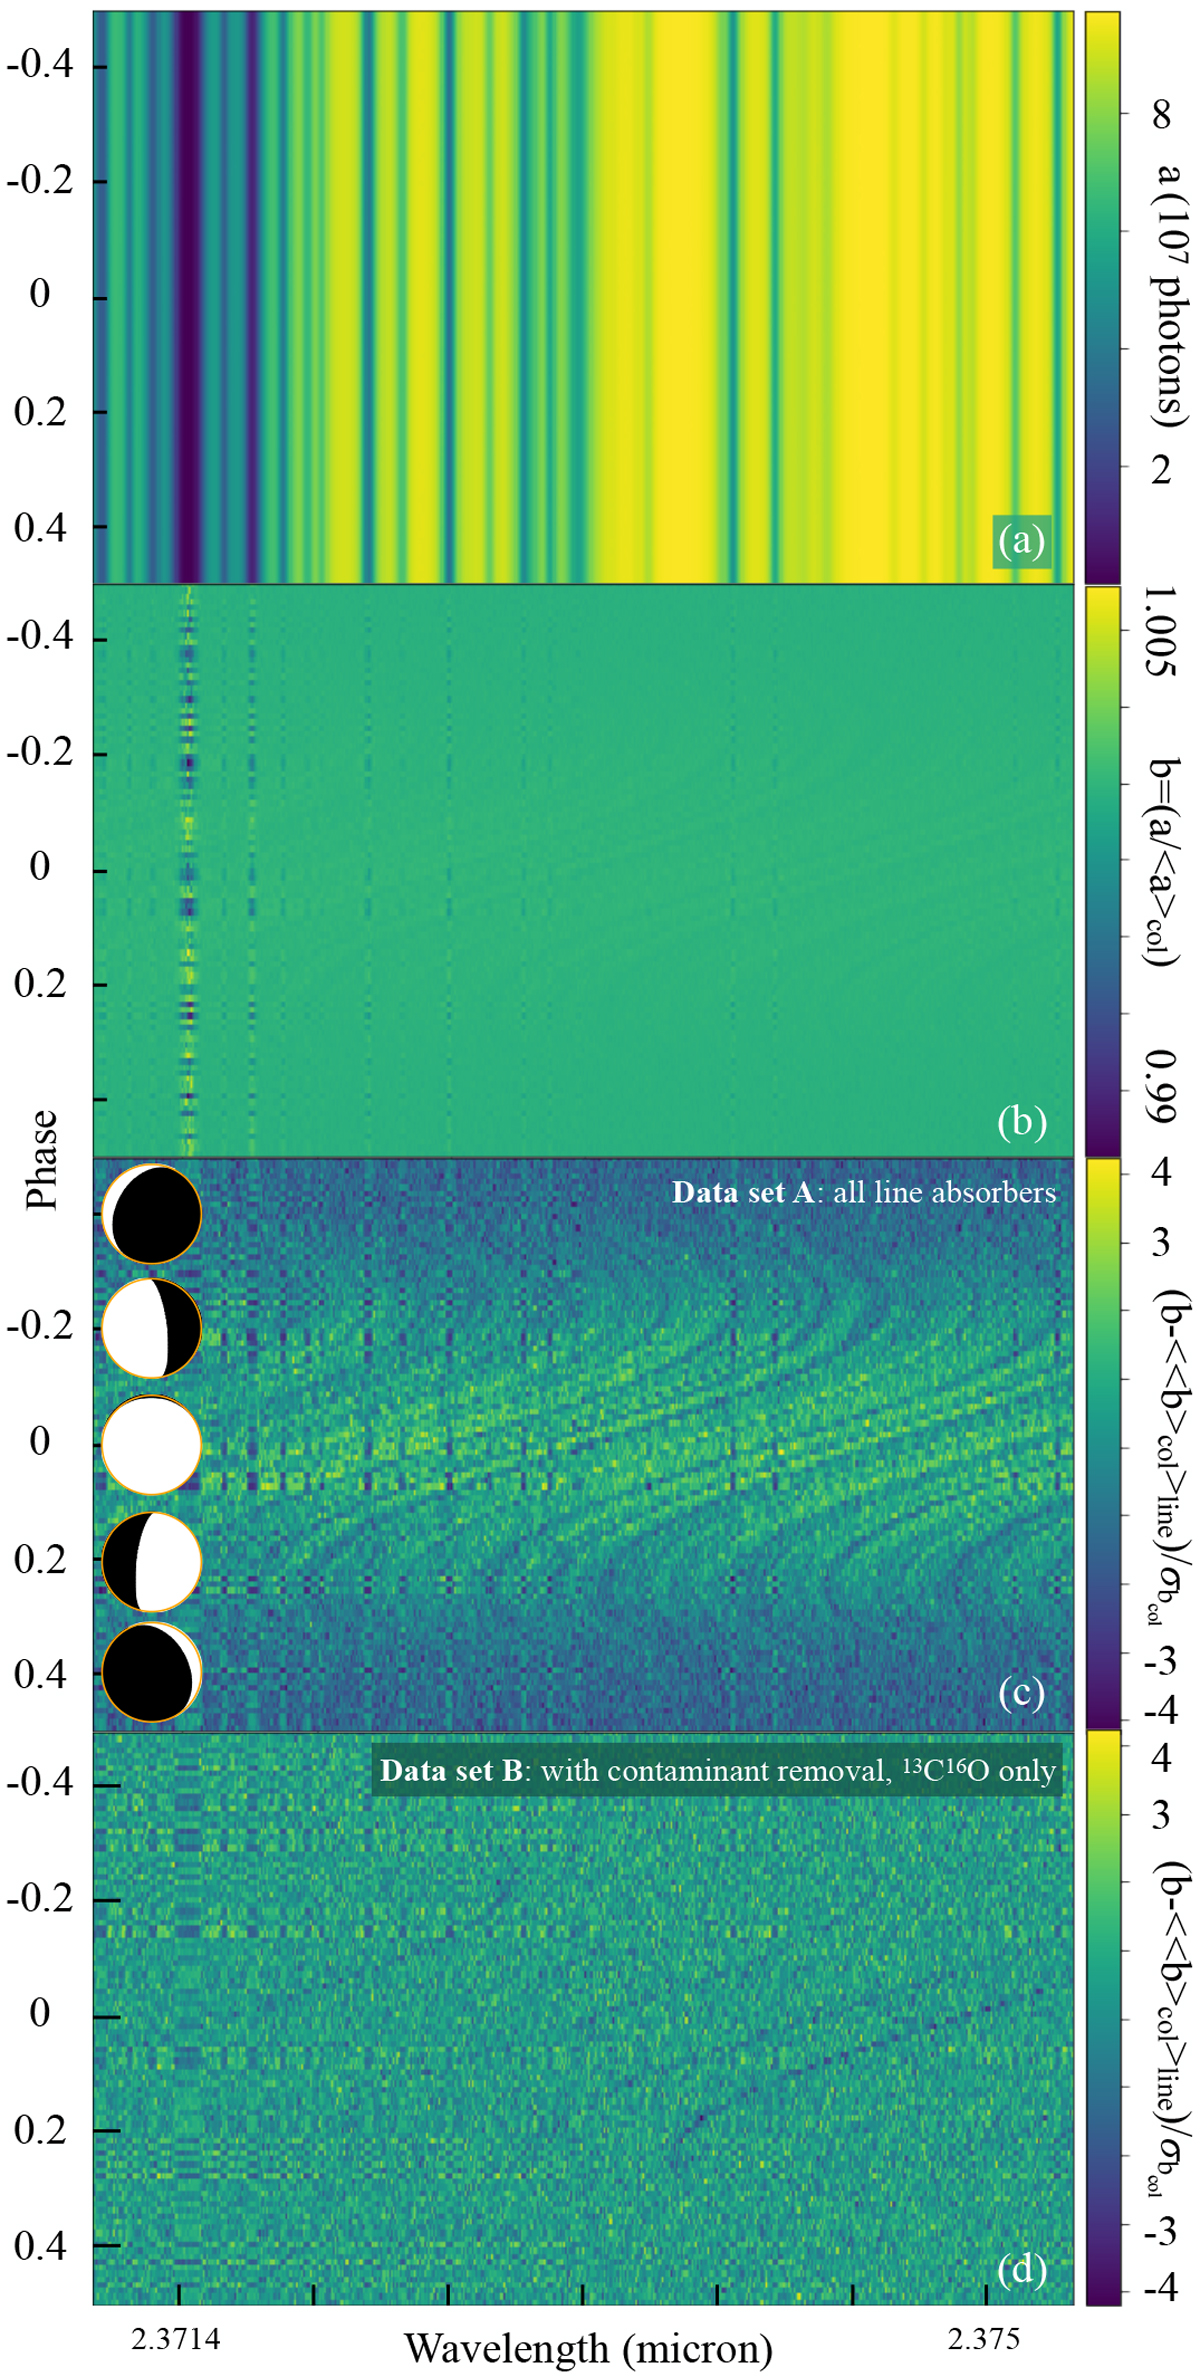
Different analysis steps of the simulated observations. Panel a: raw synthetic observation (number of photons as a function of wavelength and phase). Panel b: data after the telluric correction, as described in the text. Panel c: data of panel b after subtracting the total wavelength and phase mean, and normalising each column byits standard deviation, to suppress noisy wavelength regions. This is data set A. Panel d: same as panel c, but with the signal of all contaminant line absorbers removed, making the lines originating from 13C16O visible. Thisis data set B.
Current usage metrics show cumulative count of Article Views (full-text article views including HTML views, PDF and ePub downloads, according to the available data) and Abstracts Views on Vision4Press platform.
Data correspond to usage on the plateform after 2015. The current usage metrics is available 48-96 hours after online publication and is updated daily on week days.
Initial download of the metrics may take a while.