Fig. 4
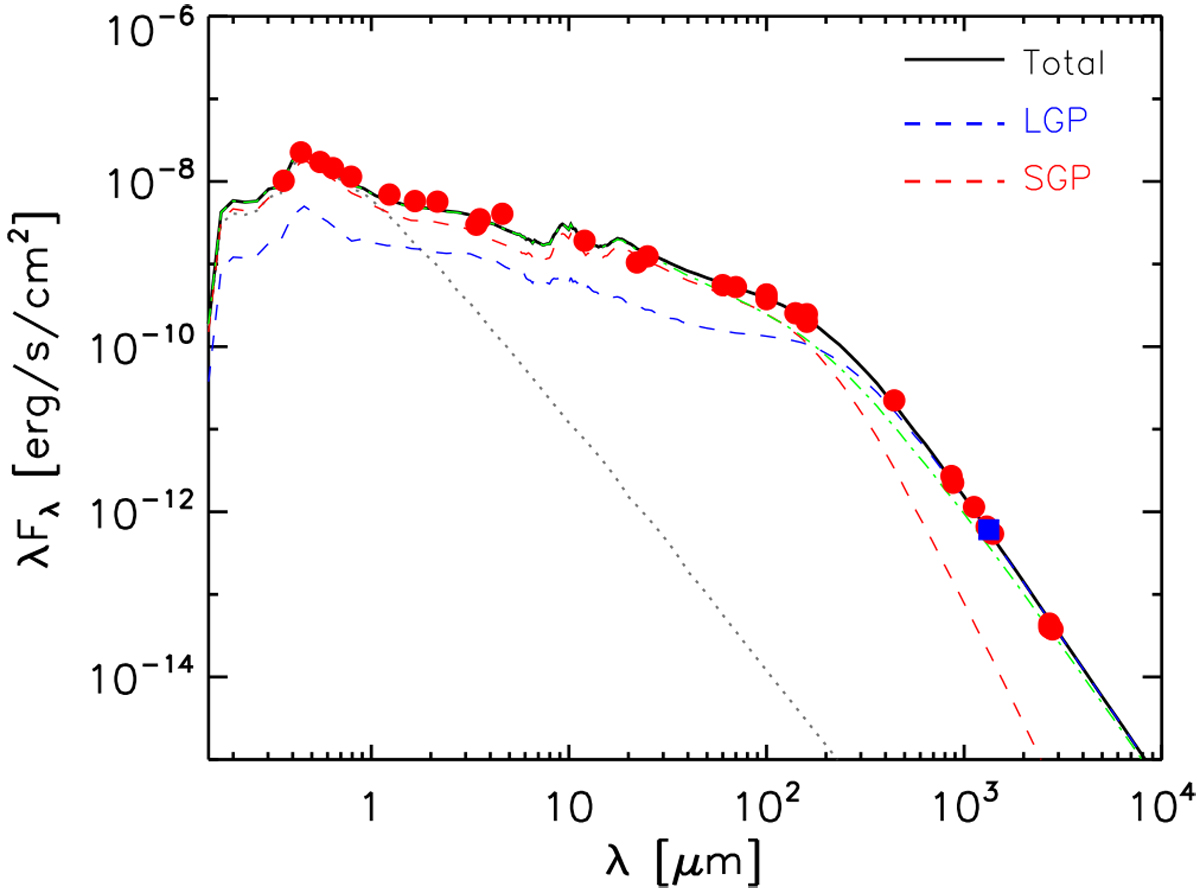
SED of the MWC 480 disk. The black line represents the best-fit model, while red dots are photometry collected from the 2MASS (Cutri et al. 2003), WISE (Cutri & et al. 2013), IRAS (Beichman et al. 1988), and AKARI surveys (Ishihara et al. 2010), Herschel/PACS (Pascual et al. 2016), UBVRI (Mendigutía et al. 2012), and sub-mm bands (Mannings & Sargent 1997; Hamidouche et al. 2006; Piétu et al. 2006; Hughes et al. 2008; Öberg et al. 2010; Guilloteau et al. 2011; Huang et al. 2017). The flux density at ALMA Band 6 in this study is highlighted with a blue square. The contributions from the small grain population and large grain population to the total flux are indicated with the red and blue dashed lines, respectively. The green dash-dottedline gives the resulting SED when the raytracing only takes into account the central emission blob (Rin ≤ R ≤ 63 au) as seen in our ALMA image, see Sect. 5.1. The gray dashed line is the input photosphere model (Kurucz 1994).
Current usage metrics show cumulative count of Article Views (full-text article views including HTML views, PDF and ePub downloads, according to the available data) and Abstracts Views on Vision4Press platform.
Data correspond to usage on the plateform after 2015. The current usage metrics is available 48-96 hours after online publication and is updated daily on week days.
Initial download of the metrics may take a while.