Free Access
Fig. 6.
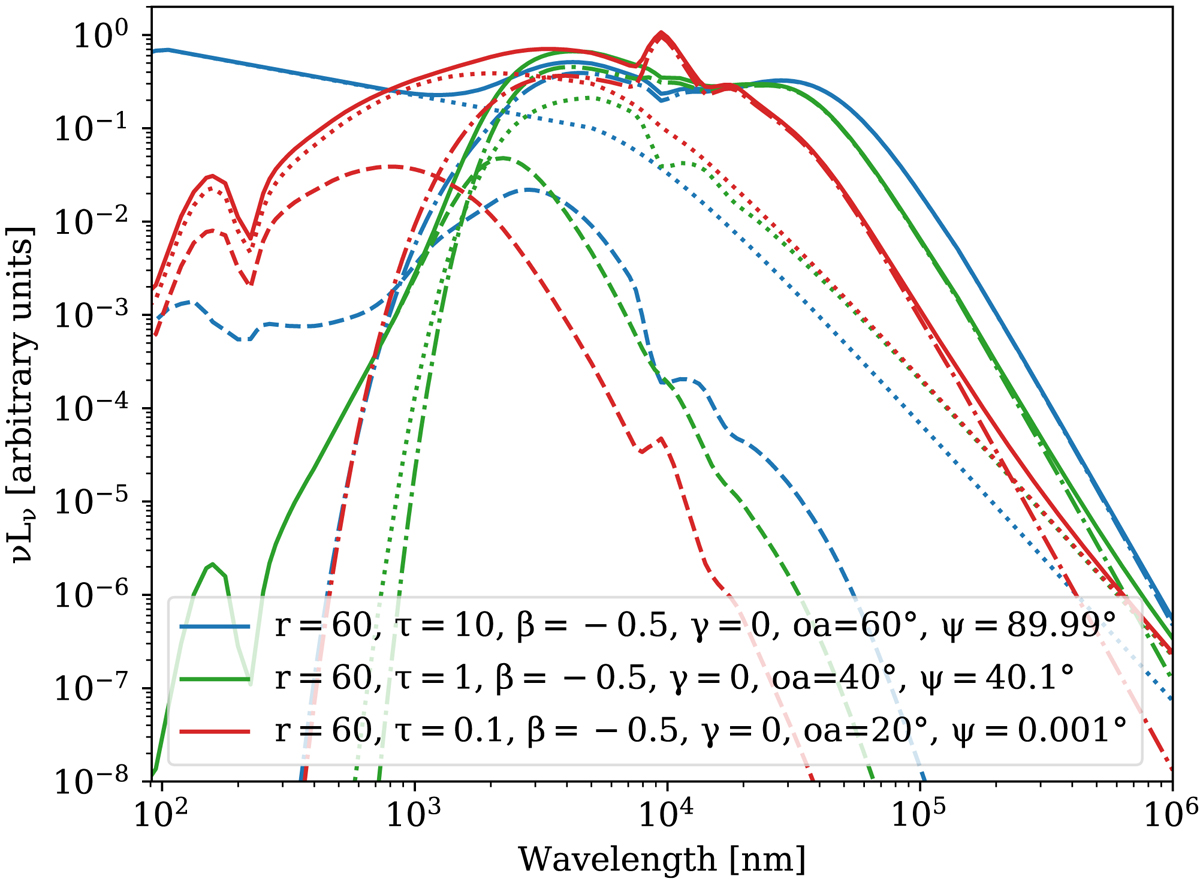
Examples of the SED produced with the fritz2006 module. Each colour indicates a different set of parameters shown in the bottom-left corner. The solid lines represent the total emission. The dotted lines represent the AGN accretion disk, the dashed lines the scattered component, and the dash-dot line the thermal emission.
Current usage metrics show cumulative count of Article Views (full-text article views including HTML views, PDF and ePub downloads, according to the available data) and Abstracts Views on Vision4Press platform.
Data correspond to usage on the plateform after 2015. The current usage metrics is available 48-96 hours after online publication and is updated daily on week days.
Initial download of the metrics may take a while.