Fig. 5.
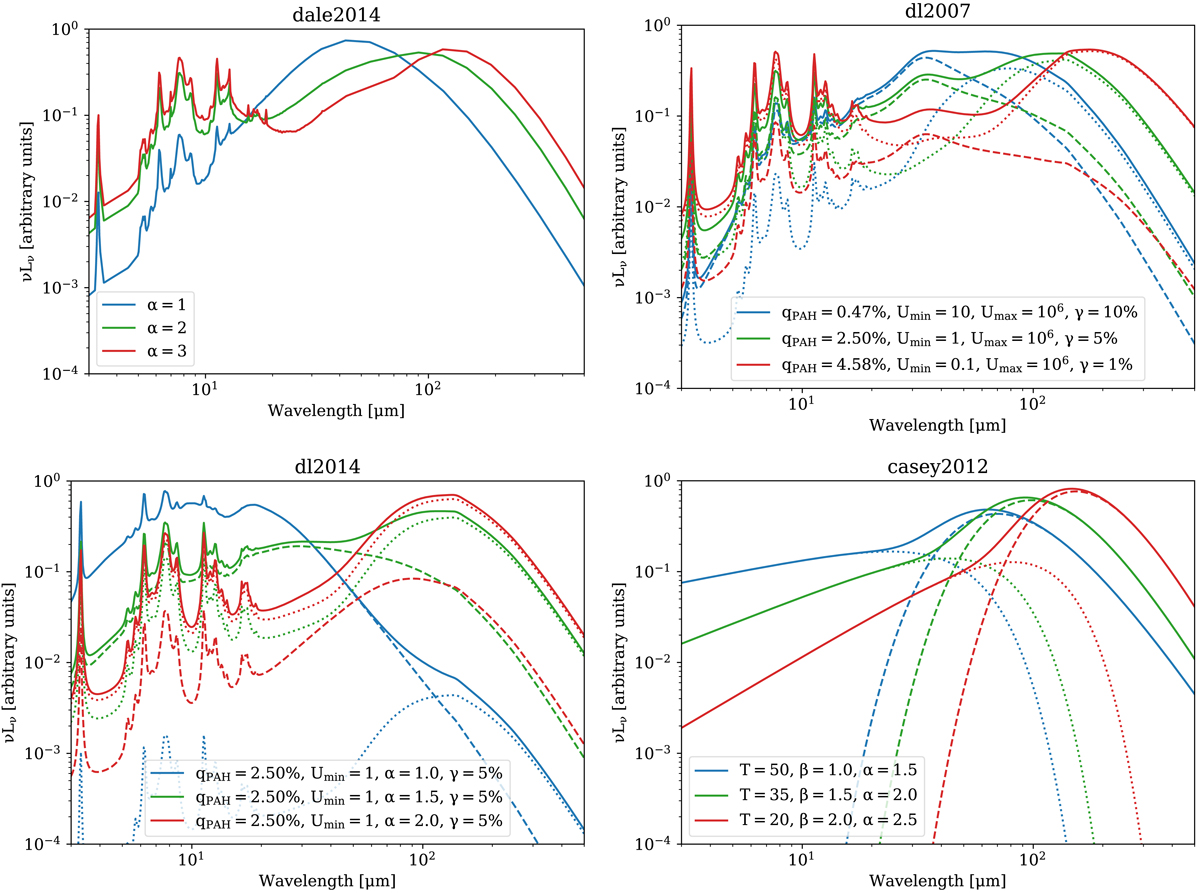
Examples of the SED produced by four of the dust modules of CIGALE: dale2014 (top-left), dl2007 (top-right), dl2014 (bottom-left), and casey2012 (bottom-right). Each colour indicates a different set of parameters shown in the bottom-right corner. The solid lines represent the total SED, summing up all components. For the dl2007 and dl2014 modules, the dashed line corresponds to the star-forming regions and the dotted line to the diffuse emission. Finally, for the casey2012 module, the dashed line corresponds to the modified black body whereas the dotted line corresponds to the power law.
Current usage metrics show cumulative count of Article Views (full-text article views including HTML views, PDF and ePub downloads, according to the available data) and Abstracts Views on Vision4Press platform.
Data correspond to usage on the plateform after 2015. The current usage metrics is available 48-96 hours after online publication and is updated daily on week days.
Initial download of the metrics may take a while.