Fig. 13.
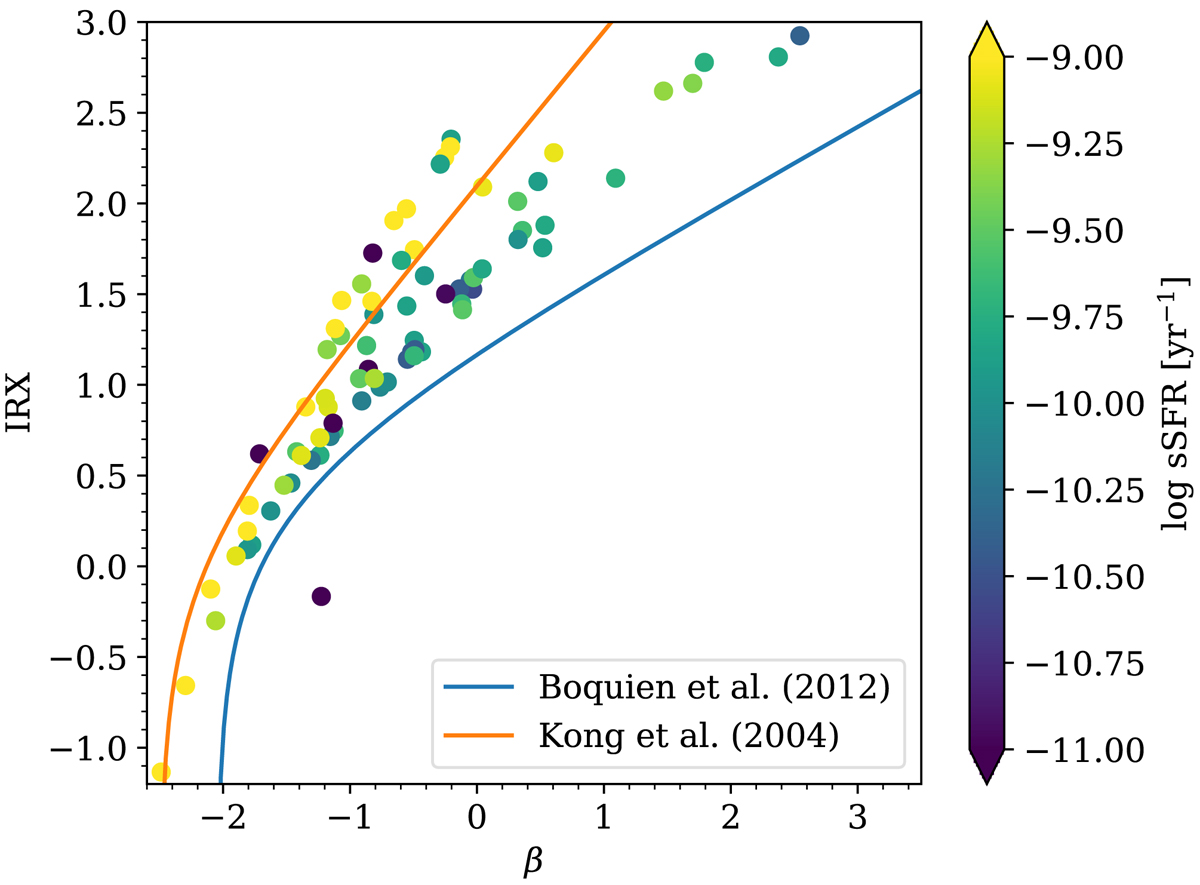
Relation between the observed IR-to-FUV luminosity (IRX) and the UV spectral slope (β) for the 129 galaxies of the Brown et al. (2014) sample. The colour of each symbol indicates the specific SFR, following the scale given by the colour bar to the right. The locus followed by resolved quiescent star-forming (respectively starburst) galaxies from Boquien et al. (2012; respectively Kong et al. 2004) is indicated by the blue (respectively orange) line.
Current usage metrics show cumulative count of Article Views (full-text article views including HTML views, PDF and ePub downloads, according to the available data) and Abstracts Views on Vision4Press platform.
Data correspond to usage on the plateform after 2015. The current usage metrics is available 48-96 hours after online publication and is updated daily on week days.
Initial download of the metrics may take a while.