Fig. 4
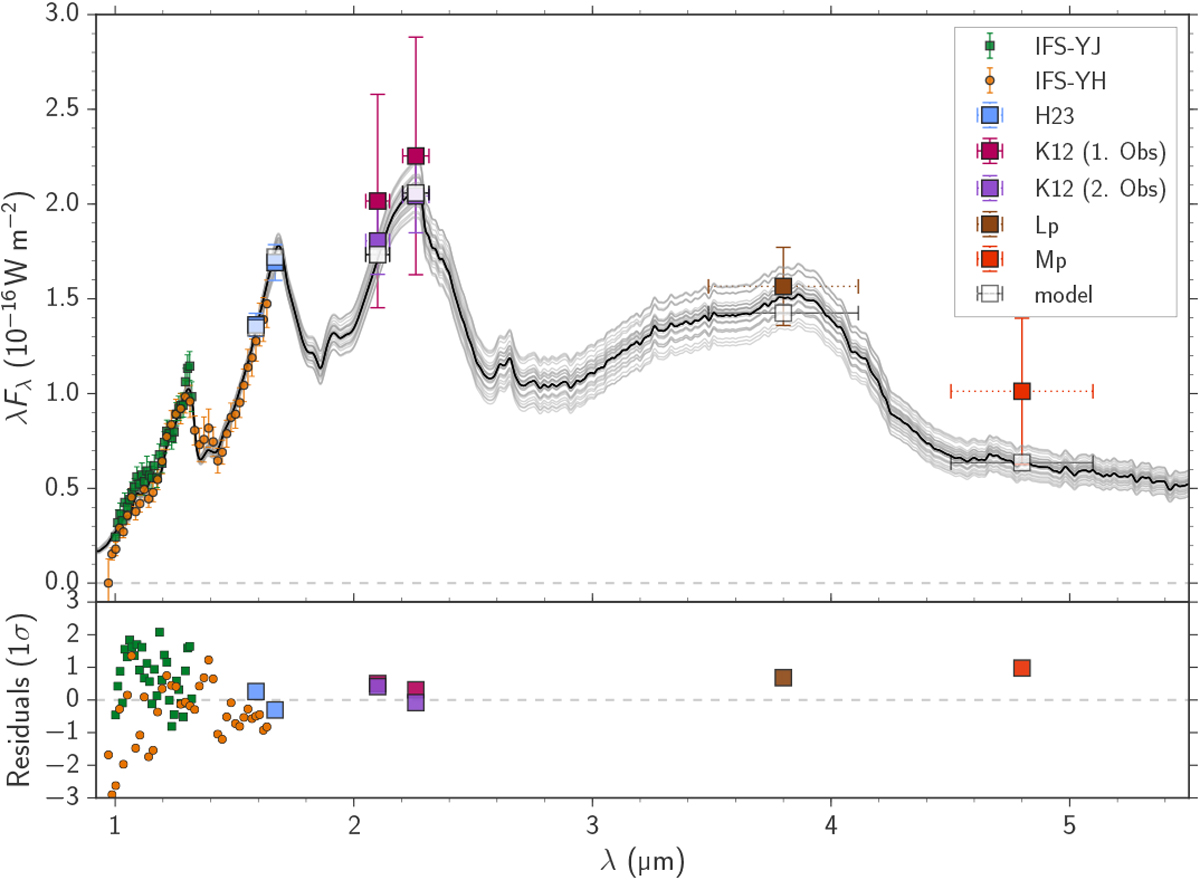
Observed spectrum of HIP 65426 b (coloured squares) compared to the best-fit spectral model from the BT-Settl grid, with Teff = 1618 K, log g = 3.78 and R = 1.17 RJ. The horizontal error bars show the width of the SPHERE and NACO filters, and the grey squares show the predicted flux calculated using the filter transmission curves. Several models drawn from the MCMC posterior distributions are also shown in grey.
Current usage metrics show cumulative count of Article Views (full-text article views including HTML views, PDF and ePub downloads, according to the available data) and Abstracts Views on Vision4Press platform.
Data correspond to usage on the plateform after 2015. The current usage metrics is available 48-96 hours after online publication and is updated daily on week days.
Initial download of the metrics may take a while.