Fig. B.1.
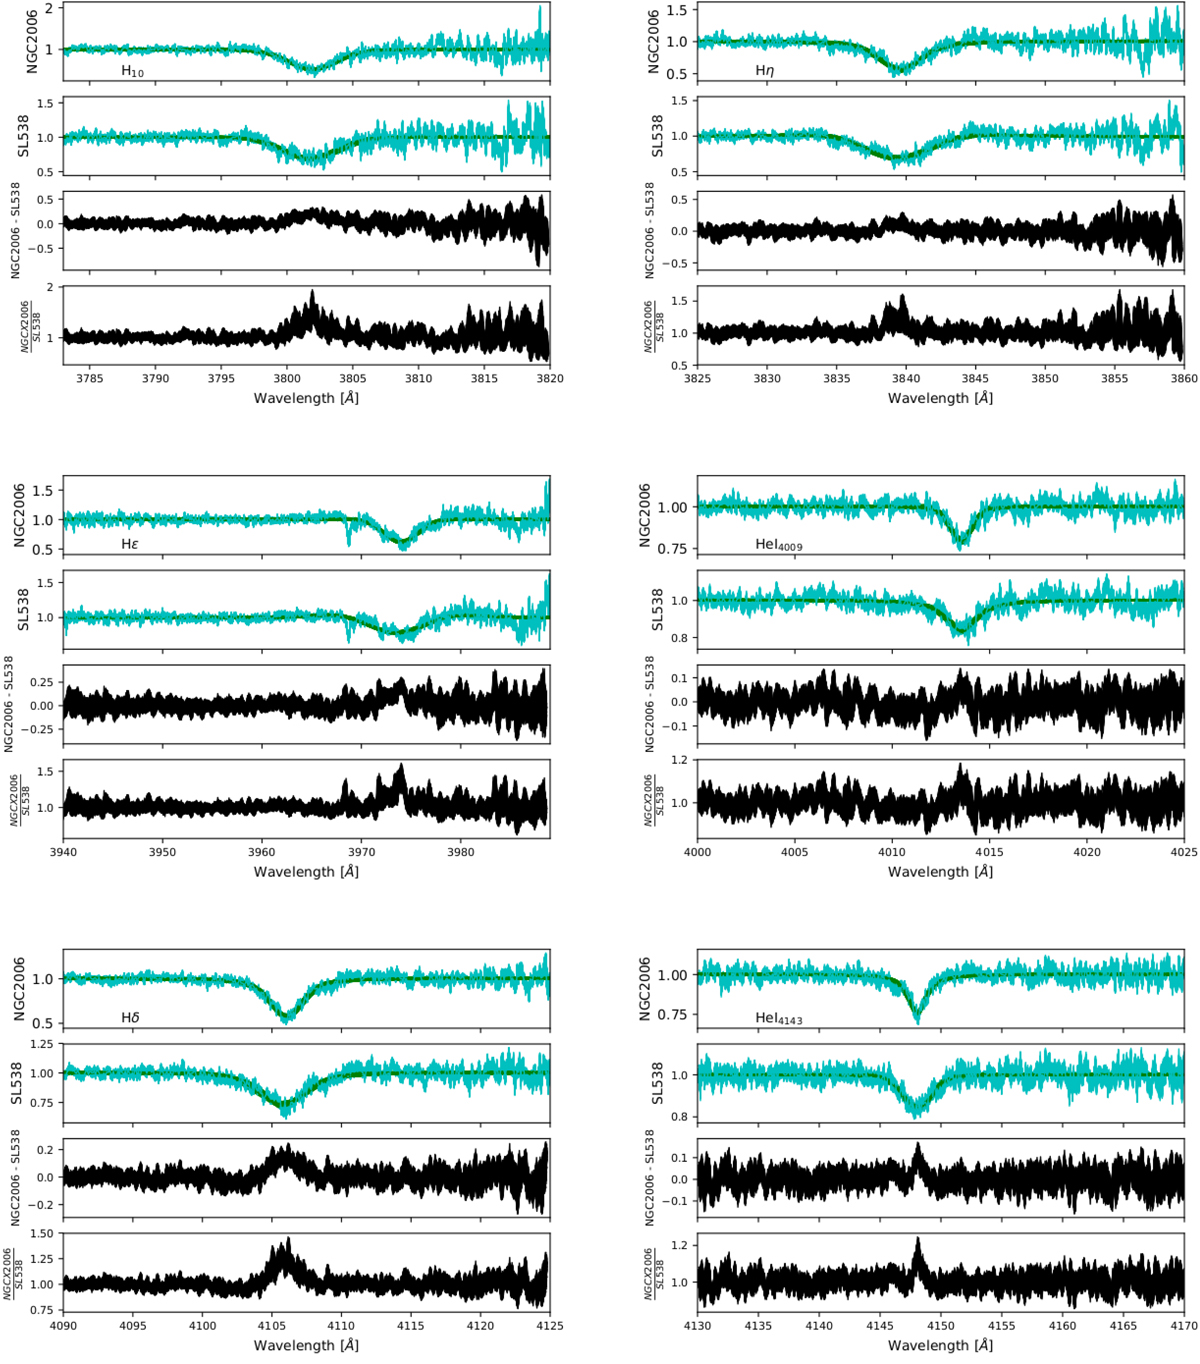
Absorption features comparison for H10, Hη, Hϵ, He I (4009.256Å), Hδ, and He I (4143.761Å). Each pair of spectra has been bootstrapped and radial-velocity corrected to be in the same rest-frame. The top panel of each figure shows the absorption feature spectrum portion for NGC 2006, while the lower panel shows the corresponding section for SL 538; the next panel below shows the normalized flux difference spectrum (NGC 2006–SL 538) and the bottom panel illustrates the flux ratio spectrum (NGC 2006/SL 538). The increasing noise seen on the right in some of the panels corresponds to the decreasing S/N of the spectra.
Current usage metrics show cumulative count of Article Views (full-text article views including HTML views, PDF and ePub downloads, according to the available data) and Abstracts Views on Vision4Press platform.
Data correspond to usage on the plateform after 2015. The current usage metrics is available 48-96 hours after online publication and is updated daily on week days.
Initial download of the metrics may take a while.