Fig. A.1.
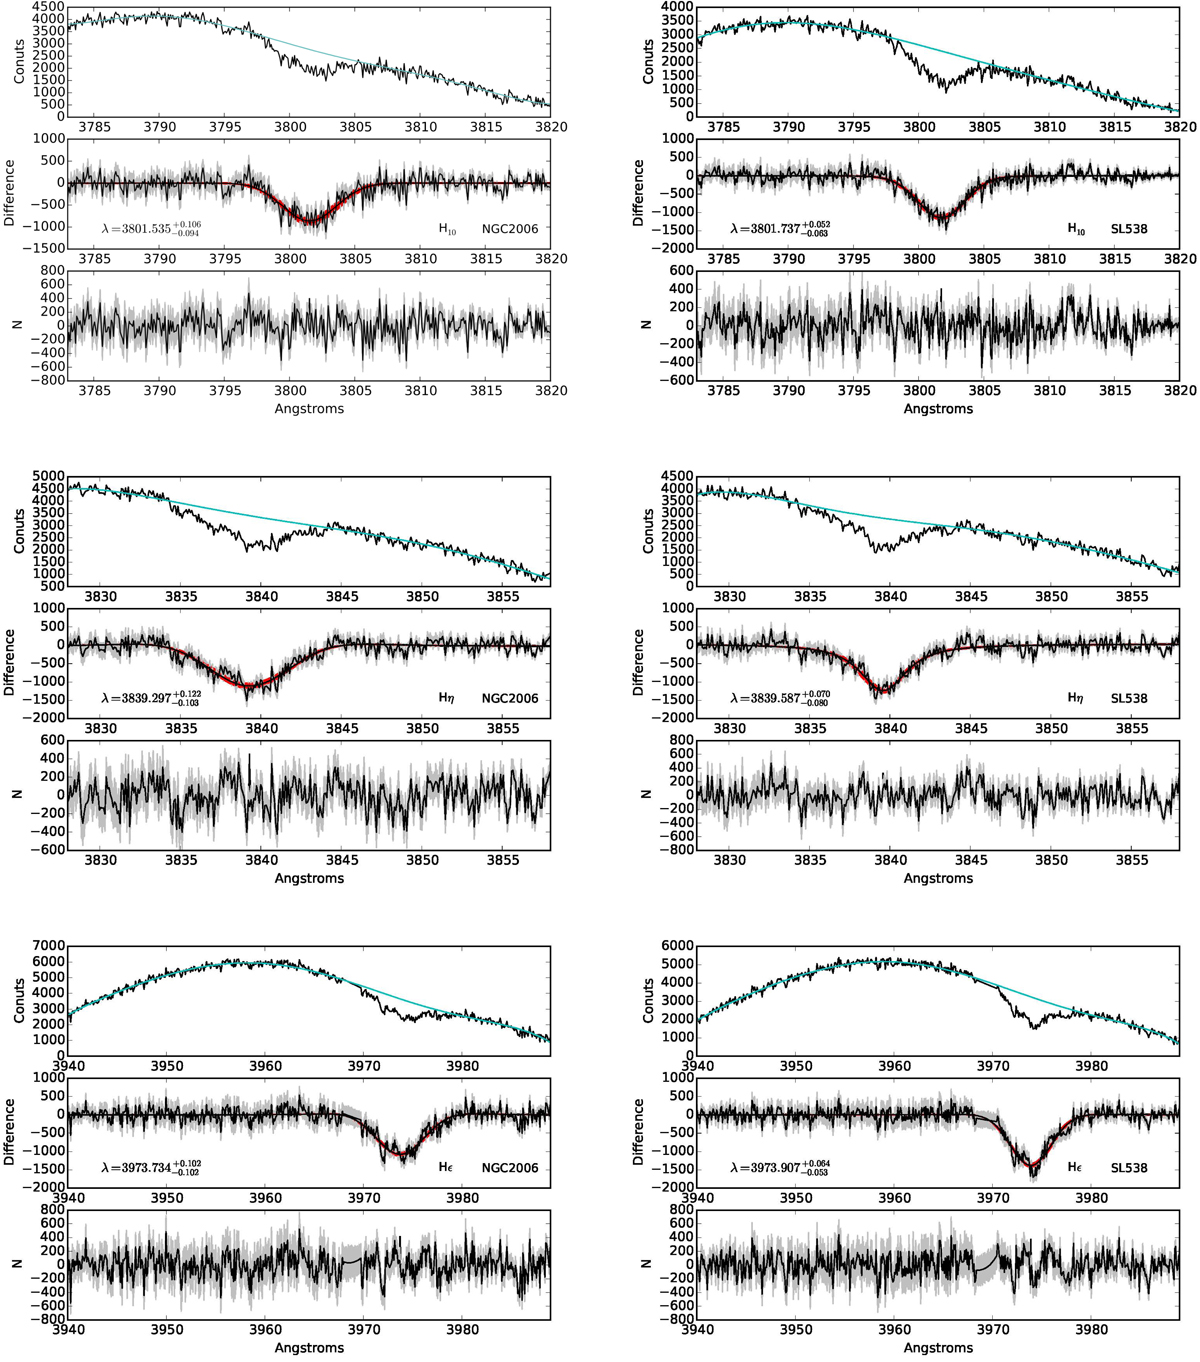
Absorption line profile fits for all features listed in Table 1. Features for the NGC 2006 spectrum are shown in the left panels, while the corresponding fits for SL 538 are given in the right panels. Each plot has three subpanels. Upper subpanel: observed spectrum near the absorption feature, where the cyan curve is the polynomial approximation to the continuum. Central subpanel: corresponds to the spectrum with the continuum subtracted, in which the black curve illustrates the Voigt profile fit, while the gray shadow represents the expected uncertainties from our bootstrapped experiments (see Sect. 4.2). The red curves in the central subpanel correspond to the bootstrapped 1σ uncertainty of the profile fit. Lower subpanels: residuals with their after continuum and profile subtraction together with their 1σ uncertainties as gray shadows. This figure shows profile fits for Balmer absorption features H10, Hη and Hϵ.
Current usage metrics show cumulative count of Article Views (full-text article views including HTML views, PDF and ePub downloads, according to the available data) and Abstracts Views on Vision4Press platform.
Data correspond to usage on the plateform after 2015. The current usage metrics is available 48-96 hours after online publication and is updated daily on week days.
Initial download of the metrics may take a while.