Fig. 5
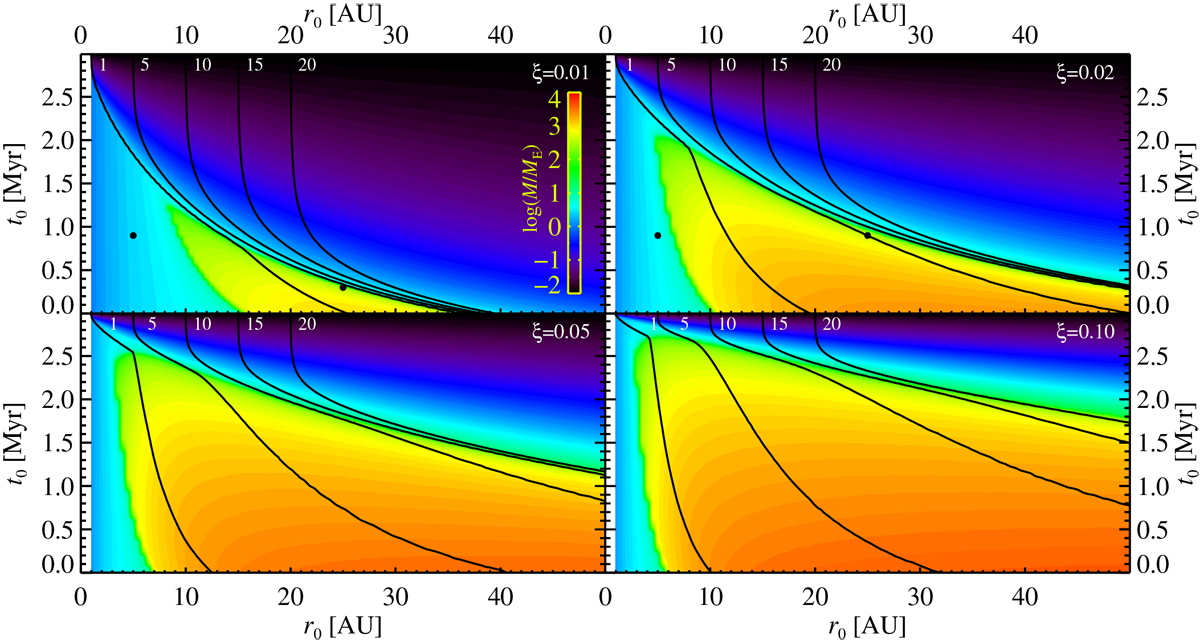
Growth maps showing final masses (colours) and selected final positions (black contours) of protoplanets starting at 1–50 AU distance from the star between 0 and 3 Myr of disc evolution. The four panels show the results for different values of the pebble-to-gas flux ratio ξ. The starting points of the selected growth tracks from Fig. 4 are indicated with dots. The cores of cold gas giants akin to Jupiter and Saturn start their assembly here in the 20–30 AU region for nominal values of ξ = 0.01–0.02. Higher values of ξ allow core assembly closer to the central star, starting in the 10–15 AU region.
Current usage metrics show cumulative count of Article Views (full-text article views including HTML views, PDF and ePub downloads, according to the available data) and Abstracts Views on Vision4Press platform.
Data correspond to usage on the plateform after 2015. The current usage metrics is available 48-96 hours after online publication and is updated daily on week days.
Initial download of the metrics may take a while.