Free Access
Fig. 4.
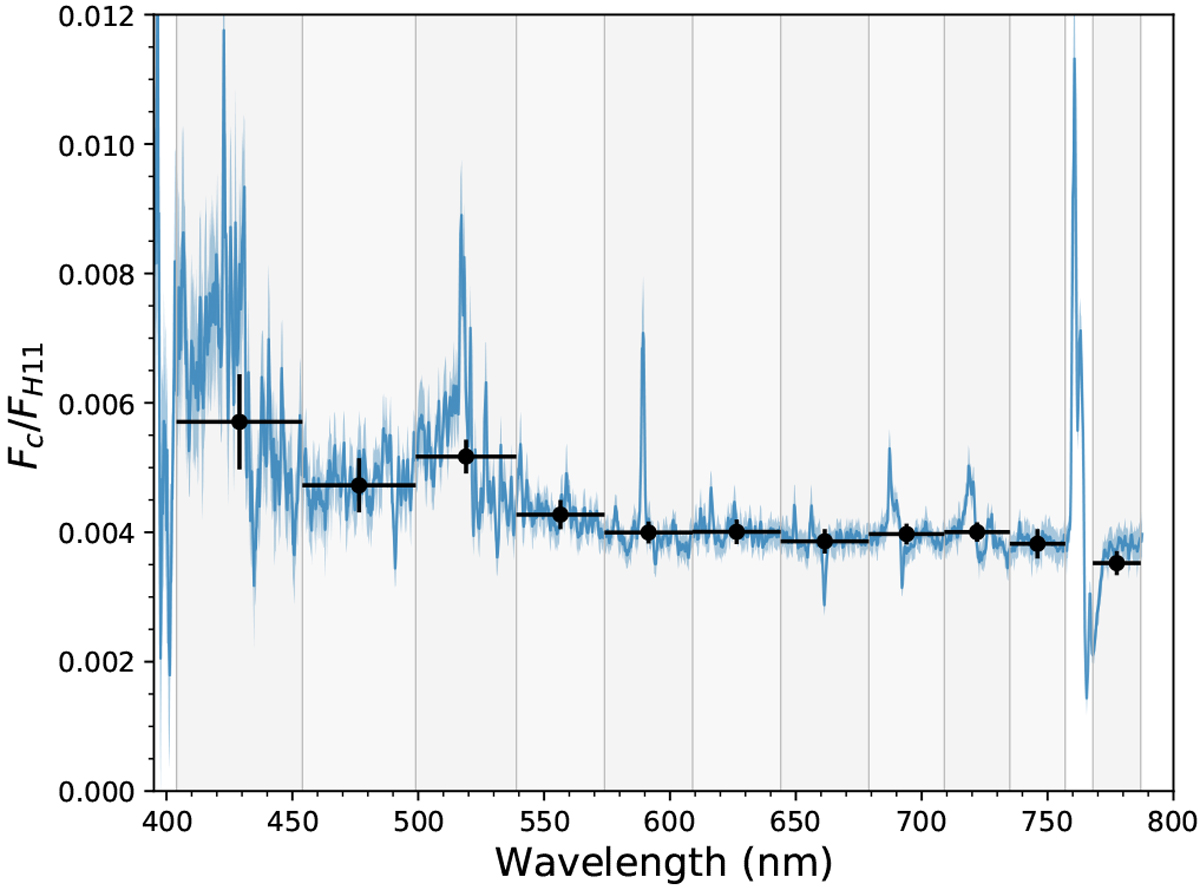
Flux ratio between HAT-P-11 and the contaminant star (blue line). The black dots show the mean flux contamination level inside the 12 bins used to compute HAT-P-11b transmission spectrum. The flux contamination level is relatively stable across the probed wavelength range.
Current usage metrics show cumulative count of Article Views (full-text article views including HTML views, PDF and ePub downloads, according to the available data) and Abstracts Views on Vision4Press platform.
Data correspond to usage on the plateform after 2015. The current usage metrics is available 48-96 hours after online publication and is updated daily on week days.
Initial download of the metrics may take a while.