Fig. 2.
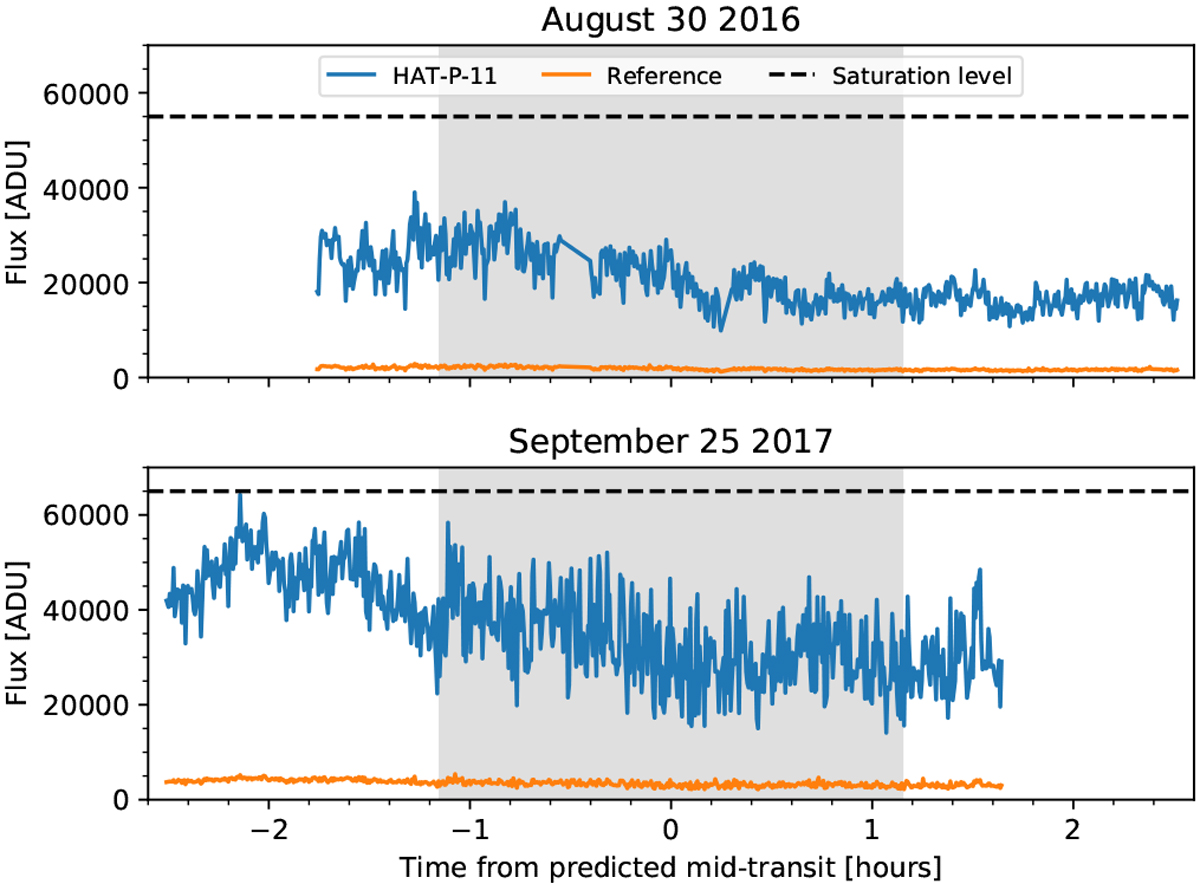
HAT-P-11 and reference star count level of the pixel with the maximum flux inside the extraction aperture for the nights of August 30, 2016 (top panel), and September 25, 2017 (bottom panel). The shaded area marks the duration of the transit and the dashed line marks the saturation levels of the detector. The different saturation levels in the two nights are due to different readout modes adopted.
Current usage metrics show cumulative count of Article Views (full-text article views including HTML views, PDF and ePub downloads, according to the available data) and Abstracts Views on Vision4Press platform.
Data correspond to usage on the plateform after 2015. The current usage metrics is available 48-96 hours after online publication and is updated daily on week days.
Initial download of the metrics may take a while.